Cluster FullStats Cluster Supertats ESX FullStats Multi Cluster Capacity Planning Multi Cluster CPU/RAM Utilization Cluster IOPS Stats Multi Cluster Usage BroStats Multi Cluster QuickStats Multi Cluster vMotion Multi Datastore Usage Multi Storage Pod Usage Cluster Network Usage Cluster Multi ESX LiteStats All Cluster Top N VM Stats Multi Cluster Top N VM Overcommit Multi Cluster Top N VM Snapshot Multi Cluster Datastore Usage Distribution Multi Cluster vCPU/pCPU Multi Cluster Top N VM Latency Multi Cluster Top N VMFS Latency vCenter Active Sessions vCenter Bad Events Cluster Hardware Sensor All Version Evo Version
Fast. Very fast. That’s what we had in mind when we designed SexiGraf. When you need vSphere metrics, the obvious way is the PerformanceManager, but we need something faster so we choosed managed object properties and quickstats like ResourcePoolQuickStats. If we have no other choice, we failback to the PerformanceManager but we only query the last 15 samples of the RealTime samplingPeriod since we pull vSphere metrics every 5 minutes.
Cluster FullStats
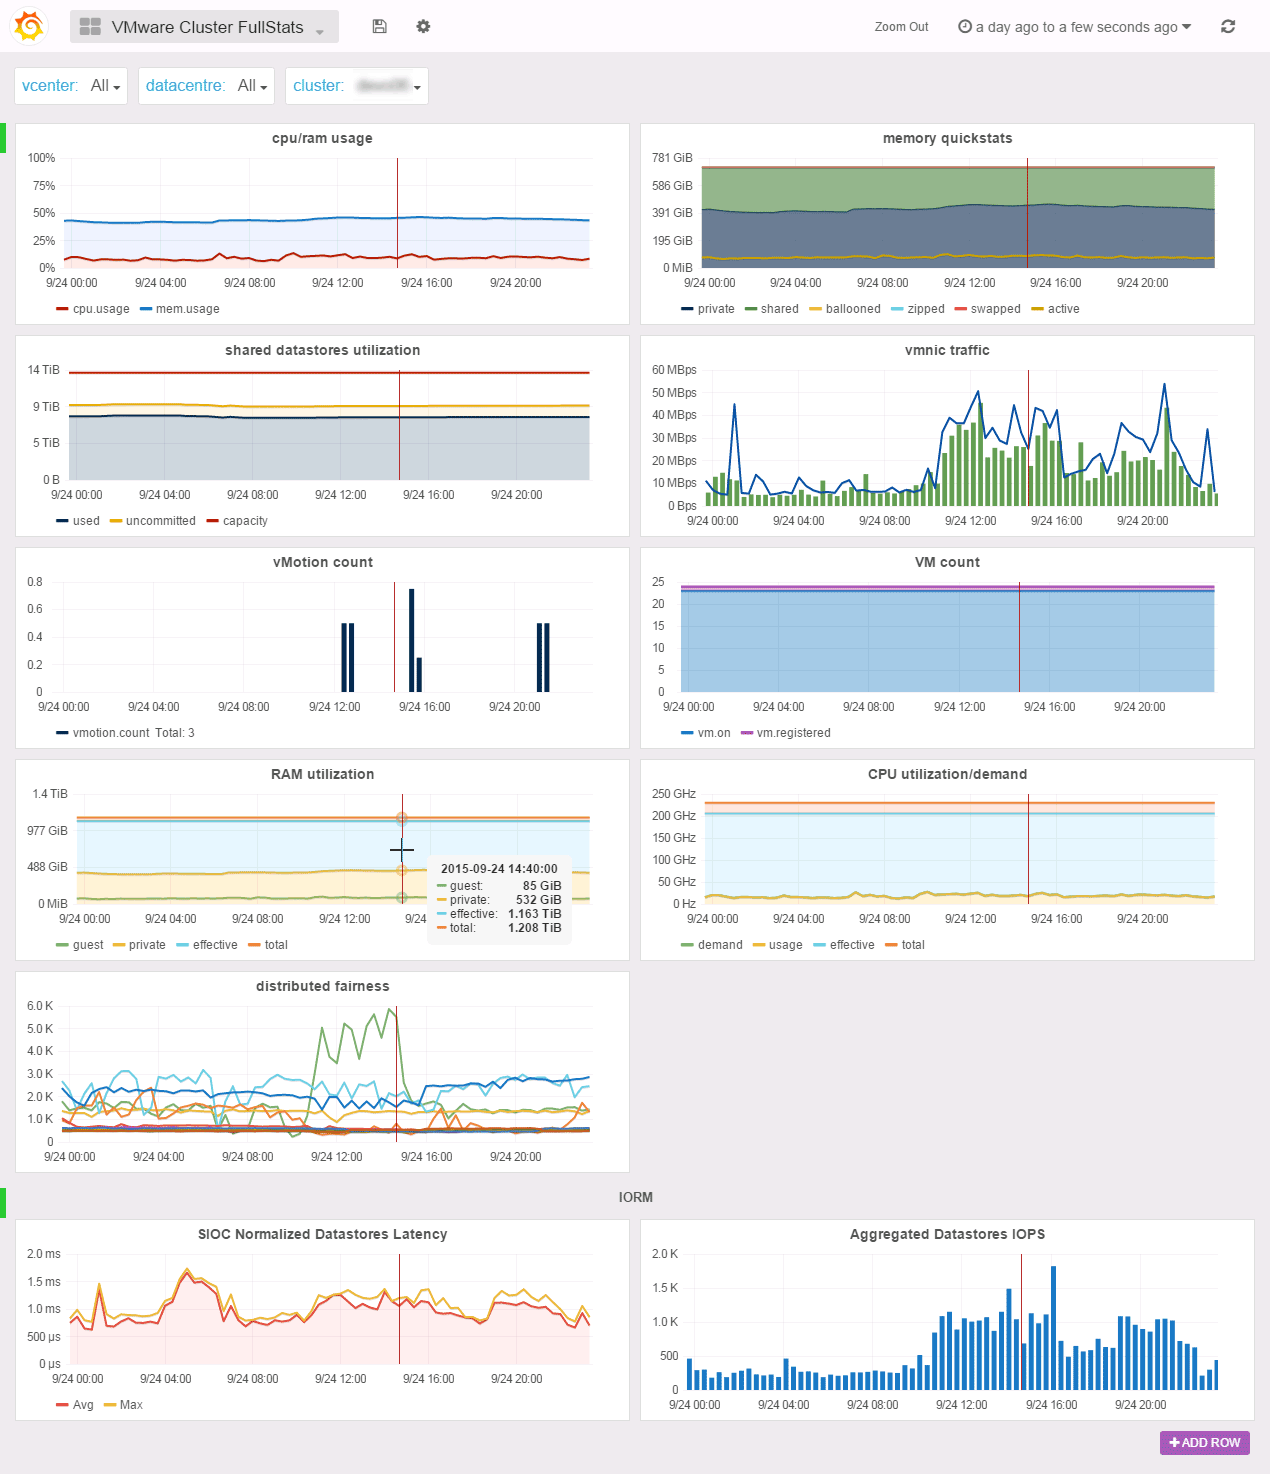
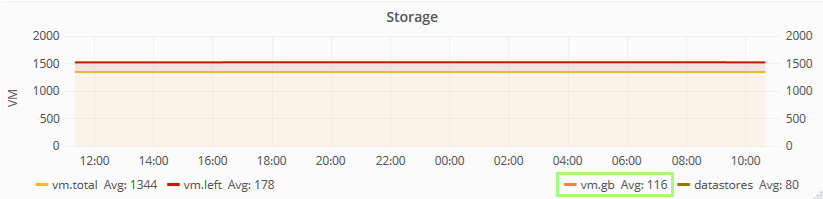
The Cluster FullStats dashboard offers you a single pane of glass for your cluster performance and usage metrics. You will find simple informations like CPU/RAM usage or vmnic traffic but also complex graph like memory quickstats (inspired by the vCenter Cluster utilization tab) or the distributed fairness graph with the fairness quickstats of distributed CPU/RAM resources allocation on the cluster hosts.
In the IOPS row, you’ll find the average latency and the IOPS sum of the cluster shared datastores. The metrics used here were initialy introduced by Storage I/O Control but since vSphere 5.1 you can chose to only collect the stats without enabling SIOC. We encourage you to do enable the stats collection since those counters are really mission critical. Besides, the latency metric resolution is 1 microsecond where the legacy latency metrics resolution is 1 milisecond and normalized meaning cluster wide latency.
If the stats collection is not enabled, we failback to the legacy read/write metrics (average latency and iops sum).
All the metrics you will find here are aggregated to give you a full cluster level experience. For example, the shared datastores utilization graph aggregates all the multipleHostAccess datastores in the cluster so you won’t see local storage here as we hope it does not participate in your vm storage.
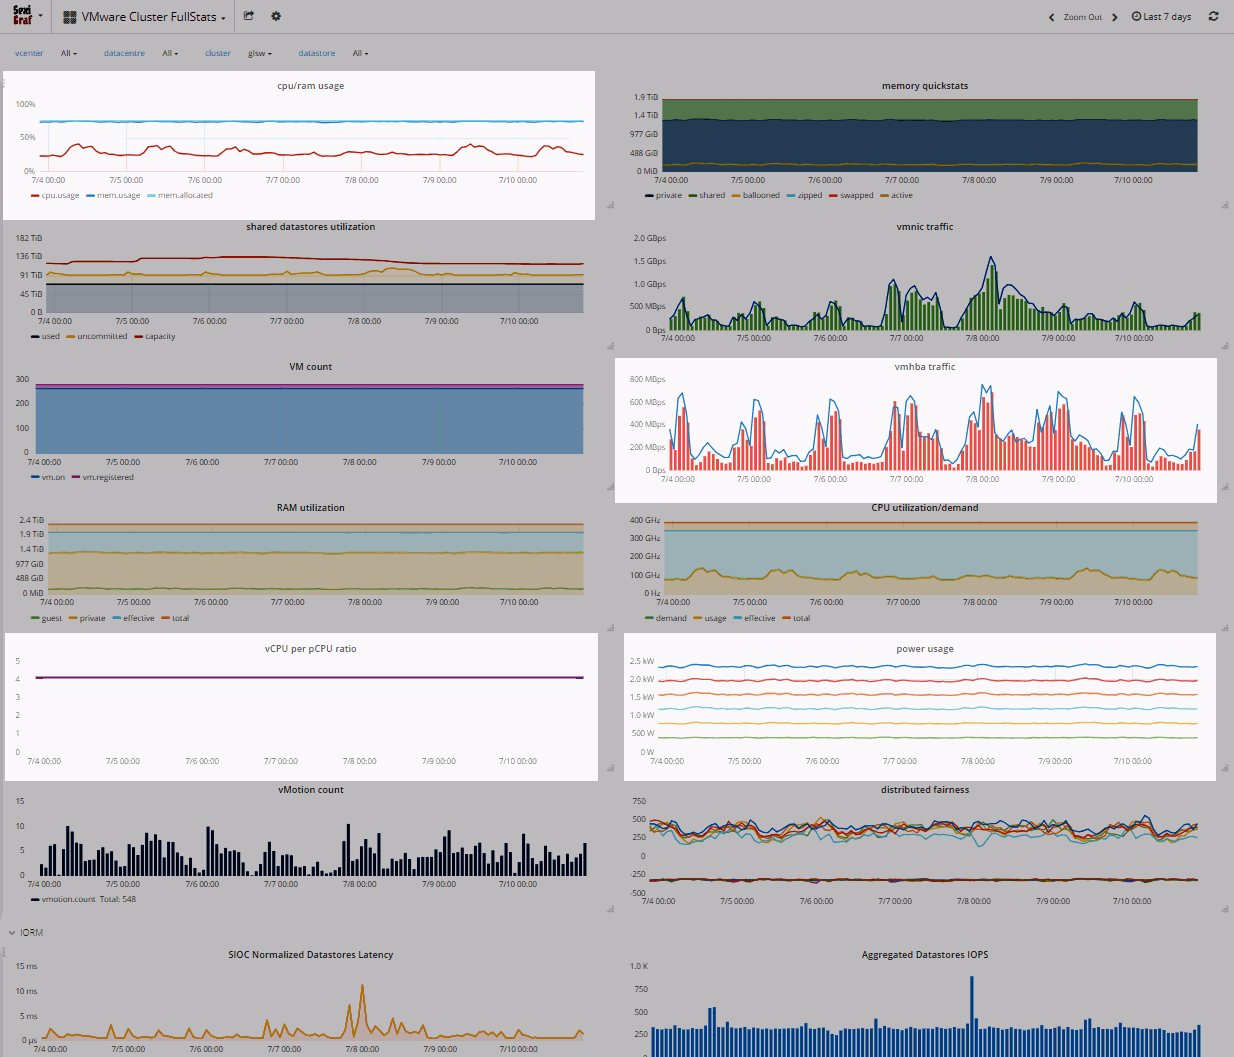
In SexiGraf 0.99d, we’ve added a mem.allocated “computed” metric (aka provisioned memory), the vCPU/pCPU ratio and the Power usage counter (for the hardware vendor that supports it). In version 0.99e, we’ve also added vmhba traffic:
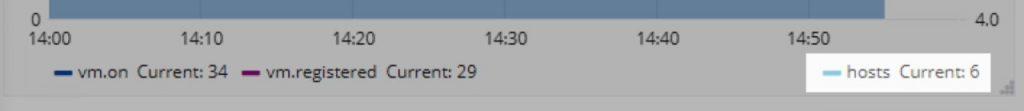
We also added hosts count in the VM count graph :
Cluster SuperStats
In SexiGraf 0.99f, we introduced new cluster level metrics computed from hosts metrics like hba, network, storage, power etc… So now you can visualise your 1000 clusters stats in a second. We’ve also added datastore count, cpu latency and allocated memory.
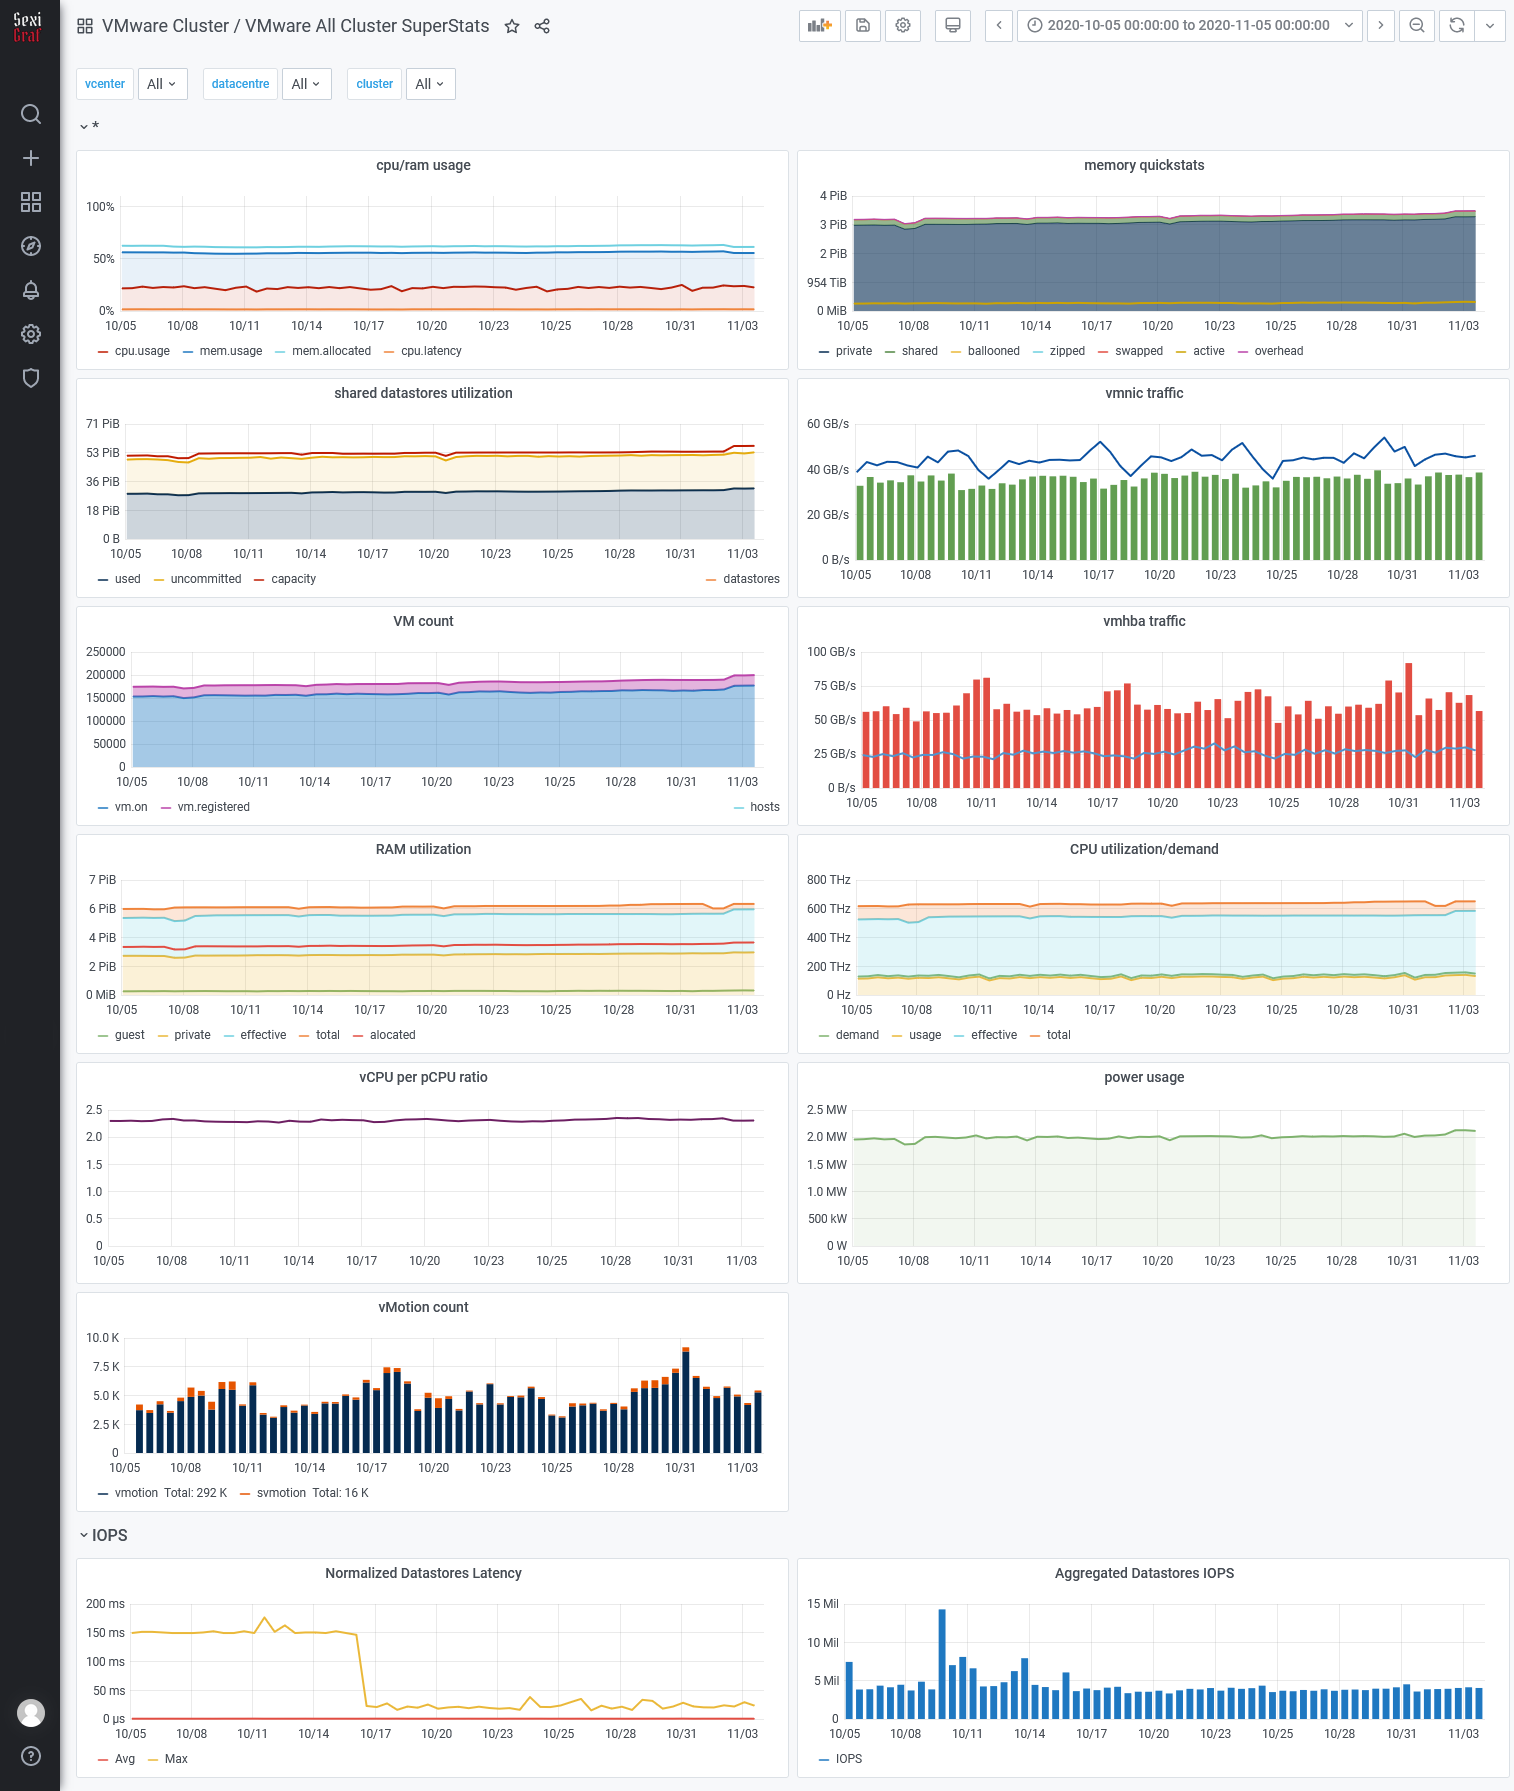
Basically, the SuperStats dashboard is simply more scalable than the FullStats but we keep the old one for compatibility purposes.
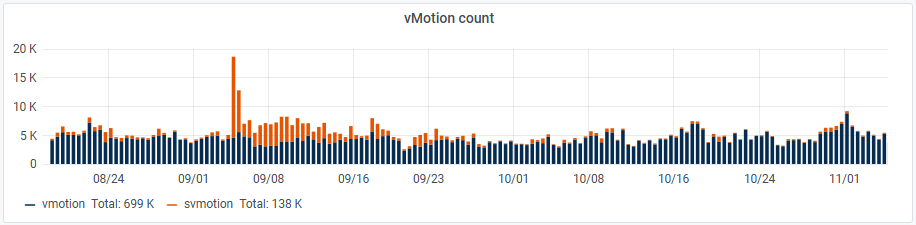
In 0.99g and 0.99h versions we’ve added memory overhead, svmotion and xvmotion count.
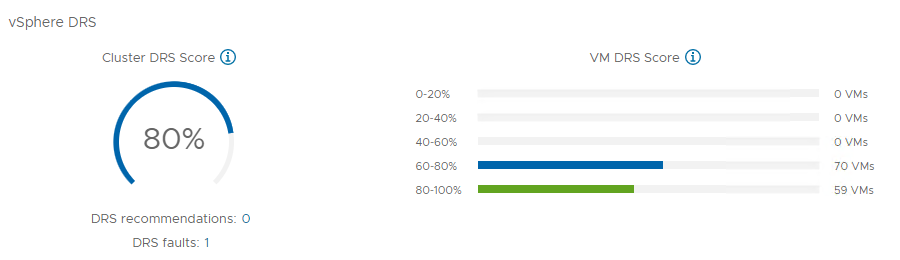
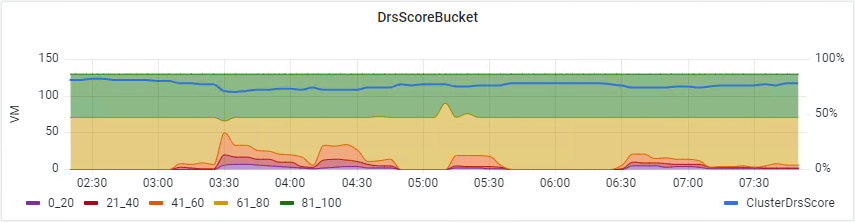
In 0.99i version we’ve added DRS Score support via a graph where you can monitor the history of your VMs and Cluster “happiness” grouped in “Buckets” like in the vCenter UI but with the ability to see what happened in the middle of the night 😉
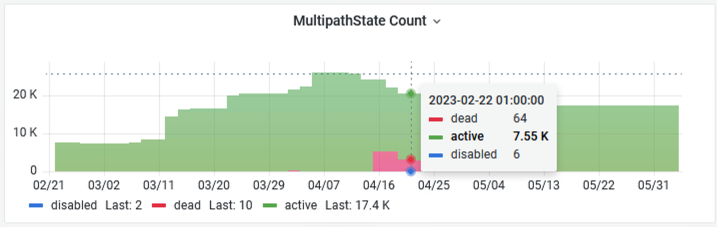
In 0.99j version we’ve added a graph where you can easily visualize the SCSI MultipathState count so you can now quickly identify LUN addition/removal but also path state changes like dead or disabled.
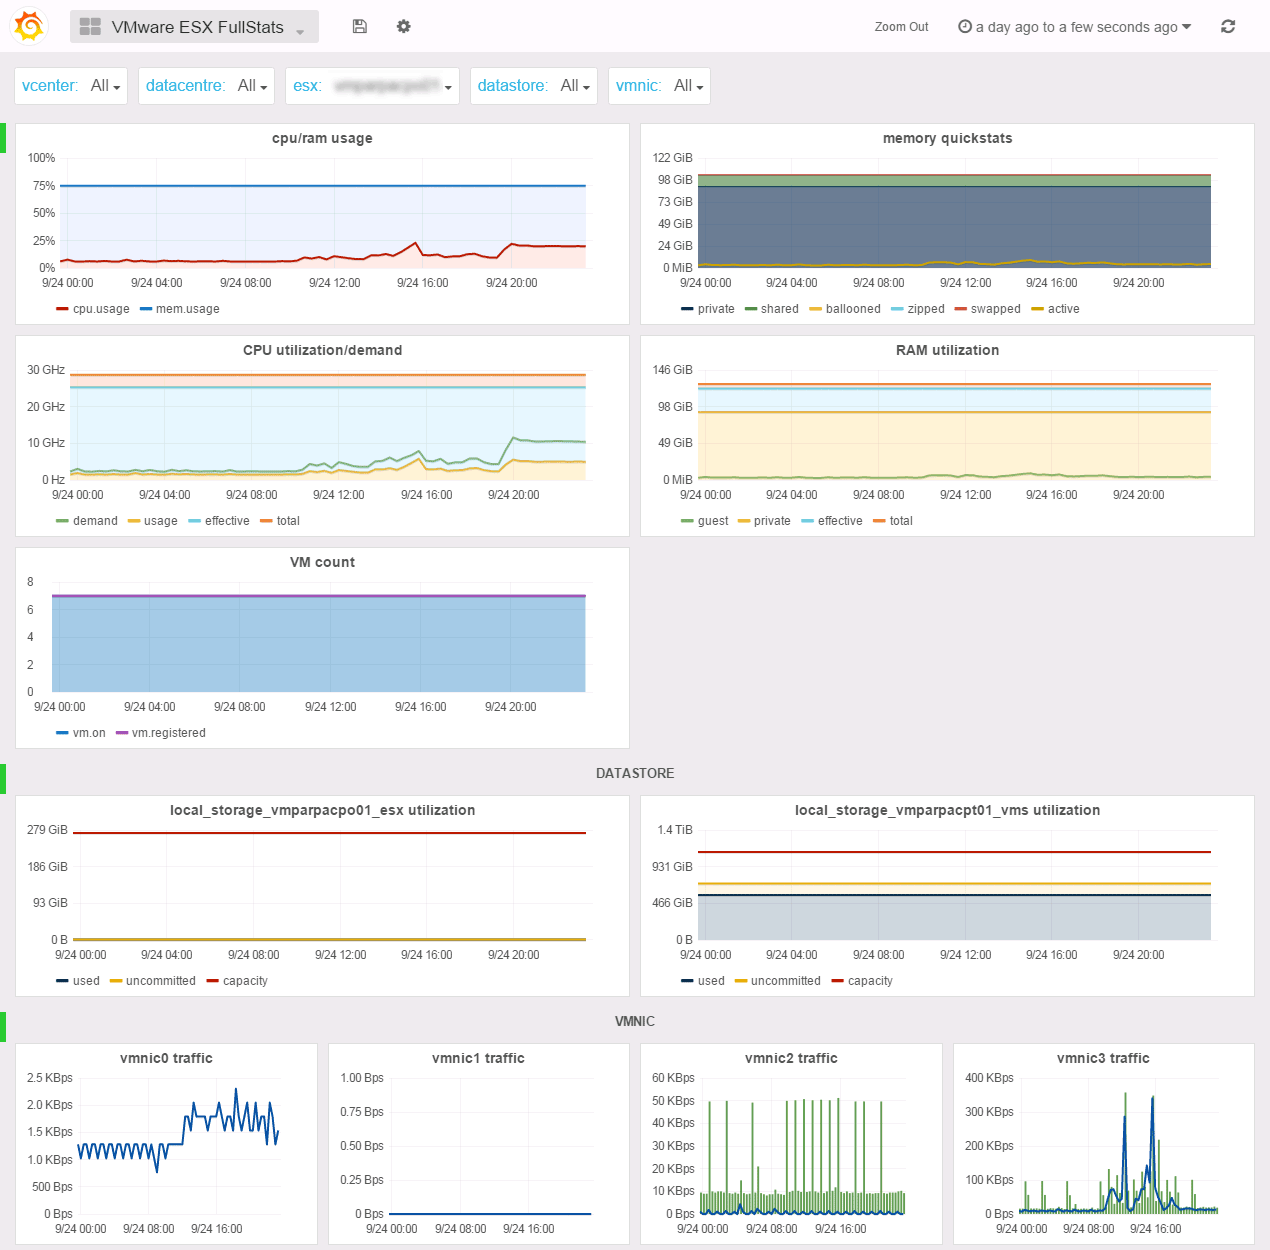
ESX FullStats
The ESX FullStats dashboard is similar to the Cluster FullStats but for standalone and unmanaged ESX servers. Because we focus on ESX resources here, we did not aggregated the datastore and vmnic metrics. You’ll find a graph for every single one of them but you can select which one will be displayed if not all.
Like in Cluster Fullstats, you’ll be able to track memory overcommit (i.e. TPS) in the memory quickstats graph but also CPU power management impact in the CPU utilization/demand graph if demand>usage.
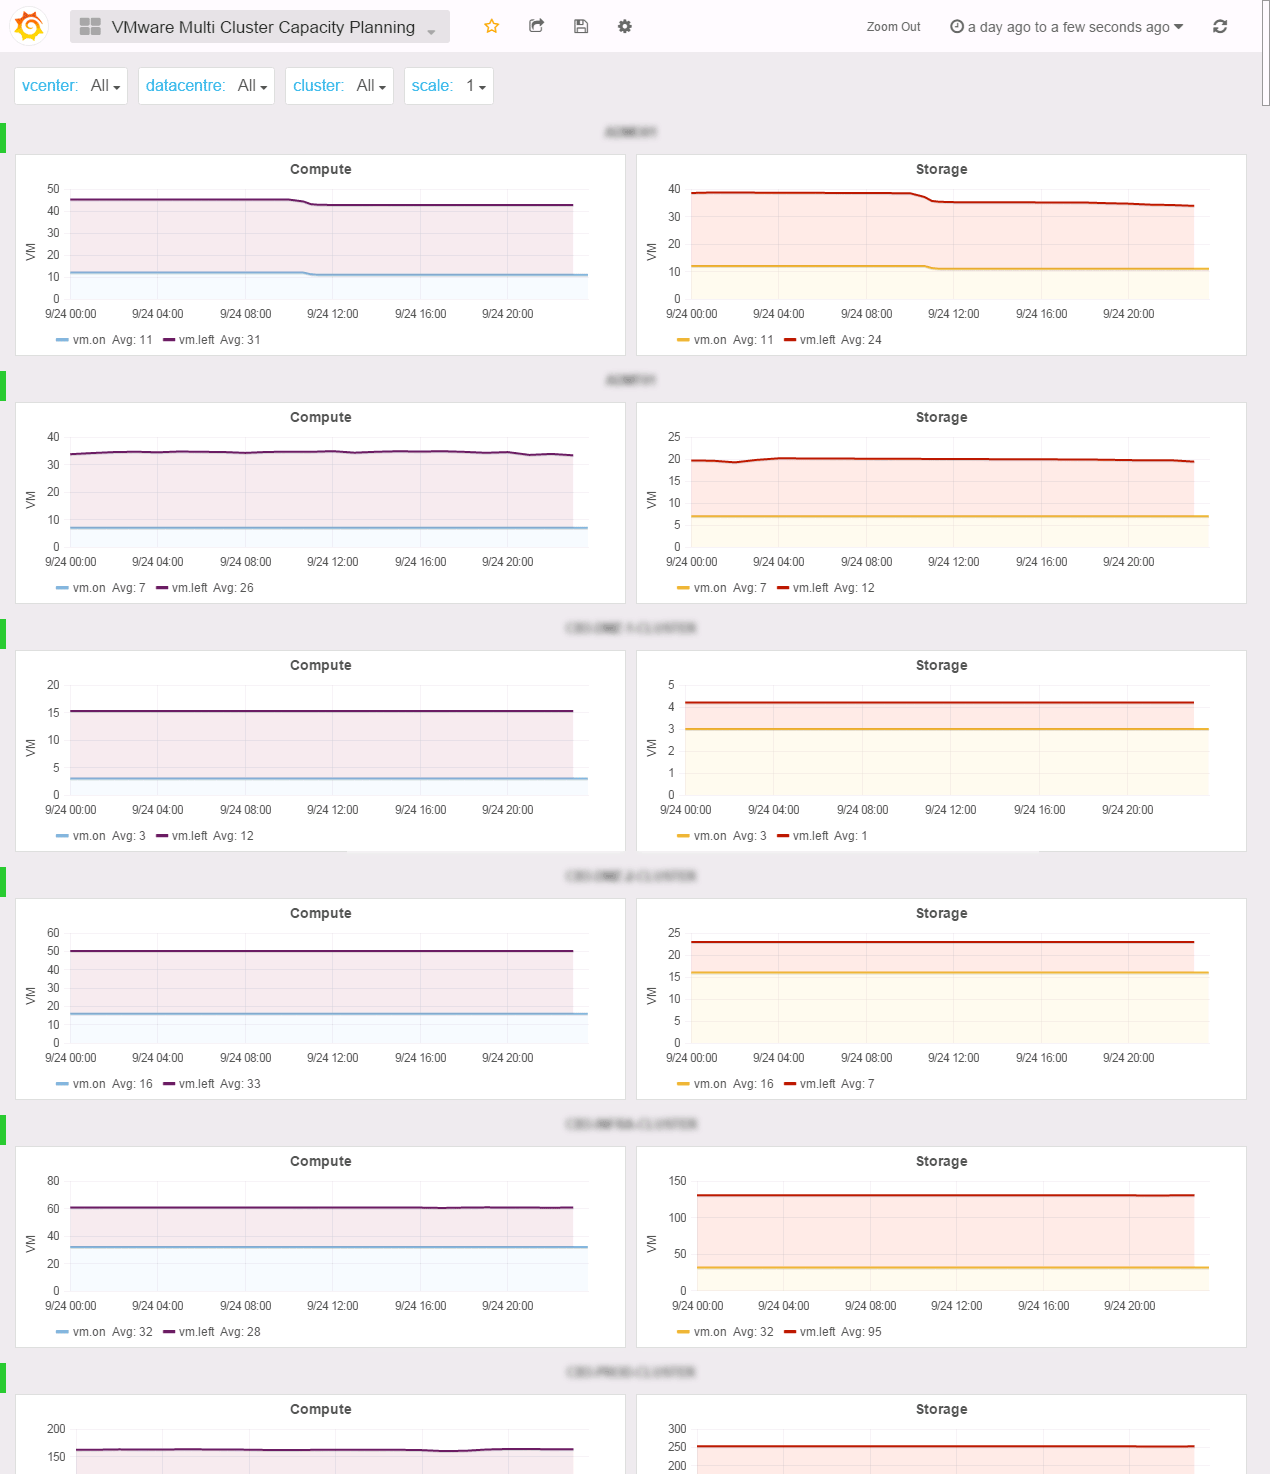
Multi Cluster Capacity Planning
“How many more VMs can we deploy on those clusters?” Your boss probably asked you this one a dozen time. This time is over. This great dashboard shows you how many vm runs and how many you got left based on compute and storage consumption for each cluster.
Want to compare only 3 of them? Just select them in the list. You got different SLA based on overcommit ratios or replication on your DR site? Use the scale variable to change the filling ratio of the compute.
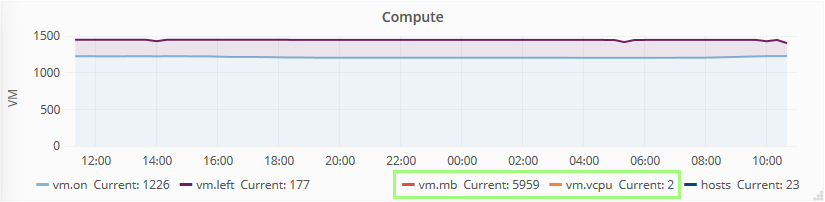
In SexiGraf 0.99f, thanks to Joe’s idea, we’ve added the vm compute and storage averages so you know what the vm left is based on:
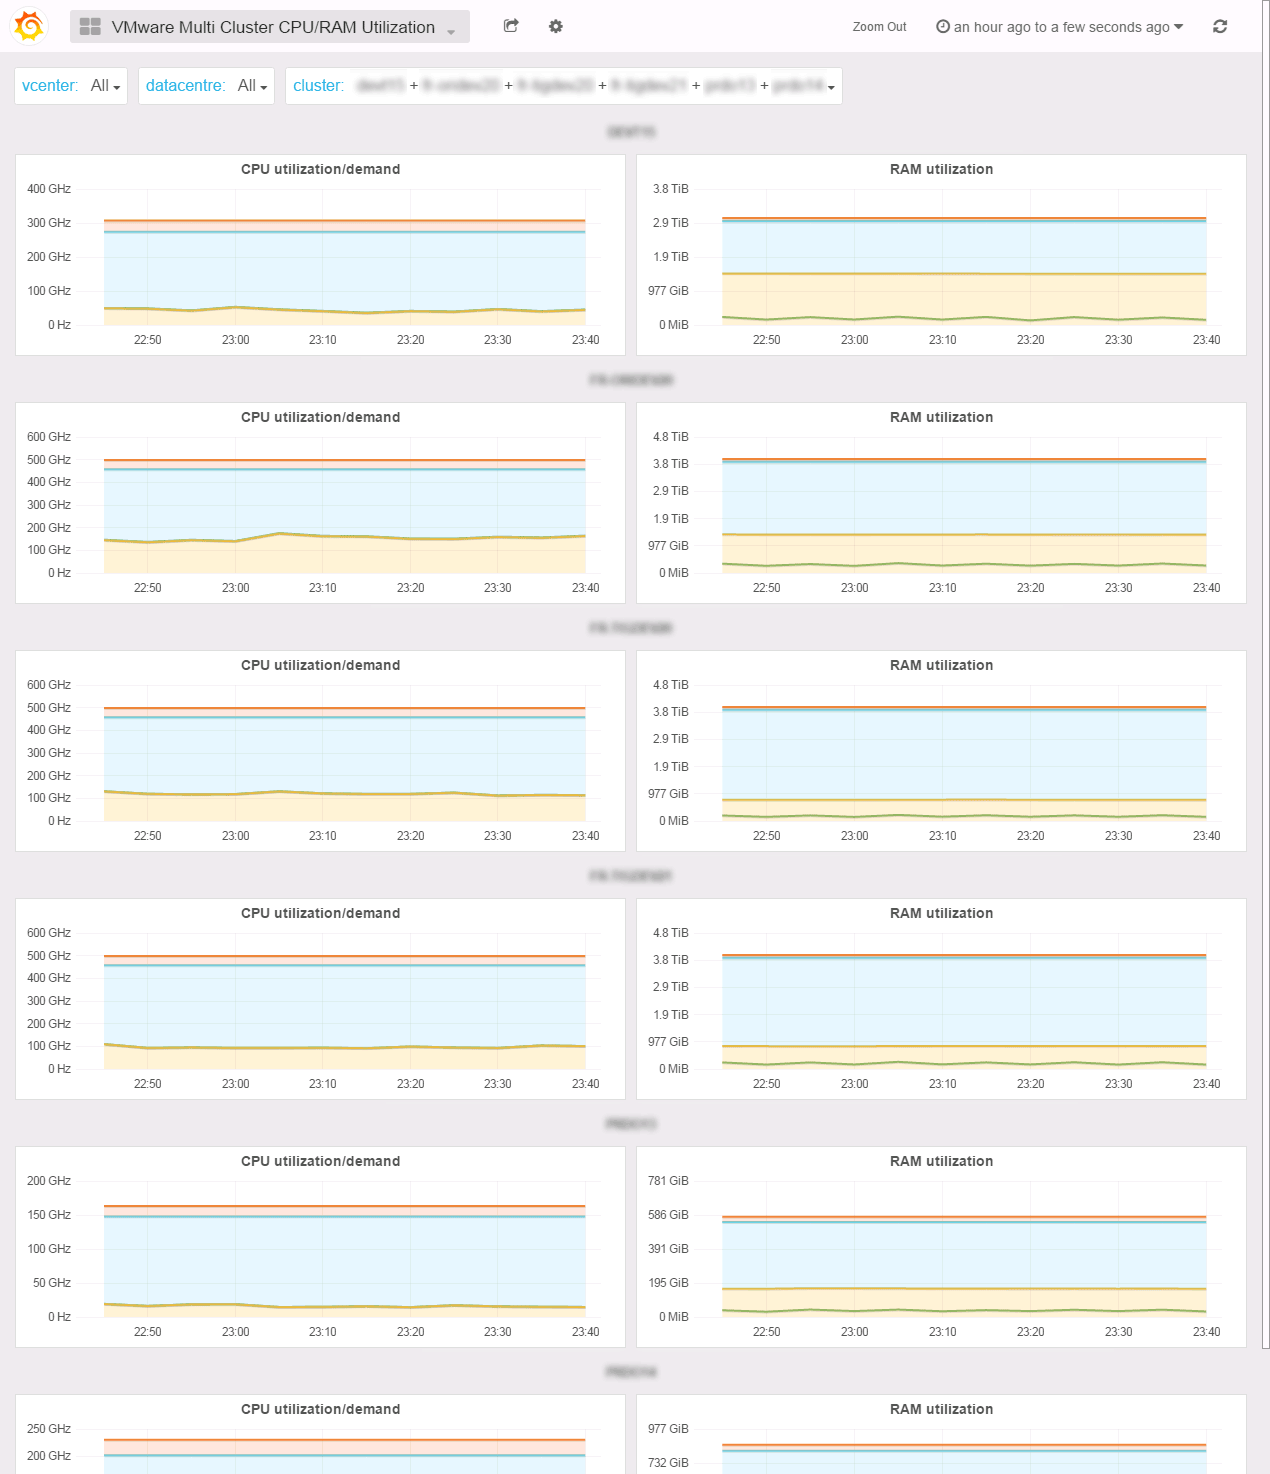
Multi Cluster CPU/RAM Utilization
The CPU/RAM Utilization dashboard allows to compare the compute metrics between clusters. Why? Because in 1s you’ll be able to catch if you forgot a host in maintenance mode in a cluster because the effective metric is much low that the total metric. You’ll also be able to see the impact of the power management policy you set on your servers with the demand and usage metrics. You may also noticed how low the guest usage (active) is compared to private metric (consumed). Or simply check how well balanced your clusters are.
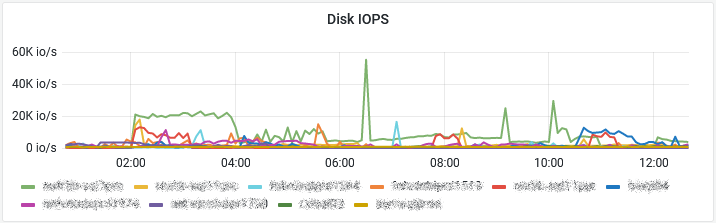
Cluster IOPS Stats
The IOPS (aka IORM/SIOC) Stats dashboard let you compare datastores Storage I/O Control latency and IOPS metrics among clusters. See Cluster FullStats dashboard for details.
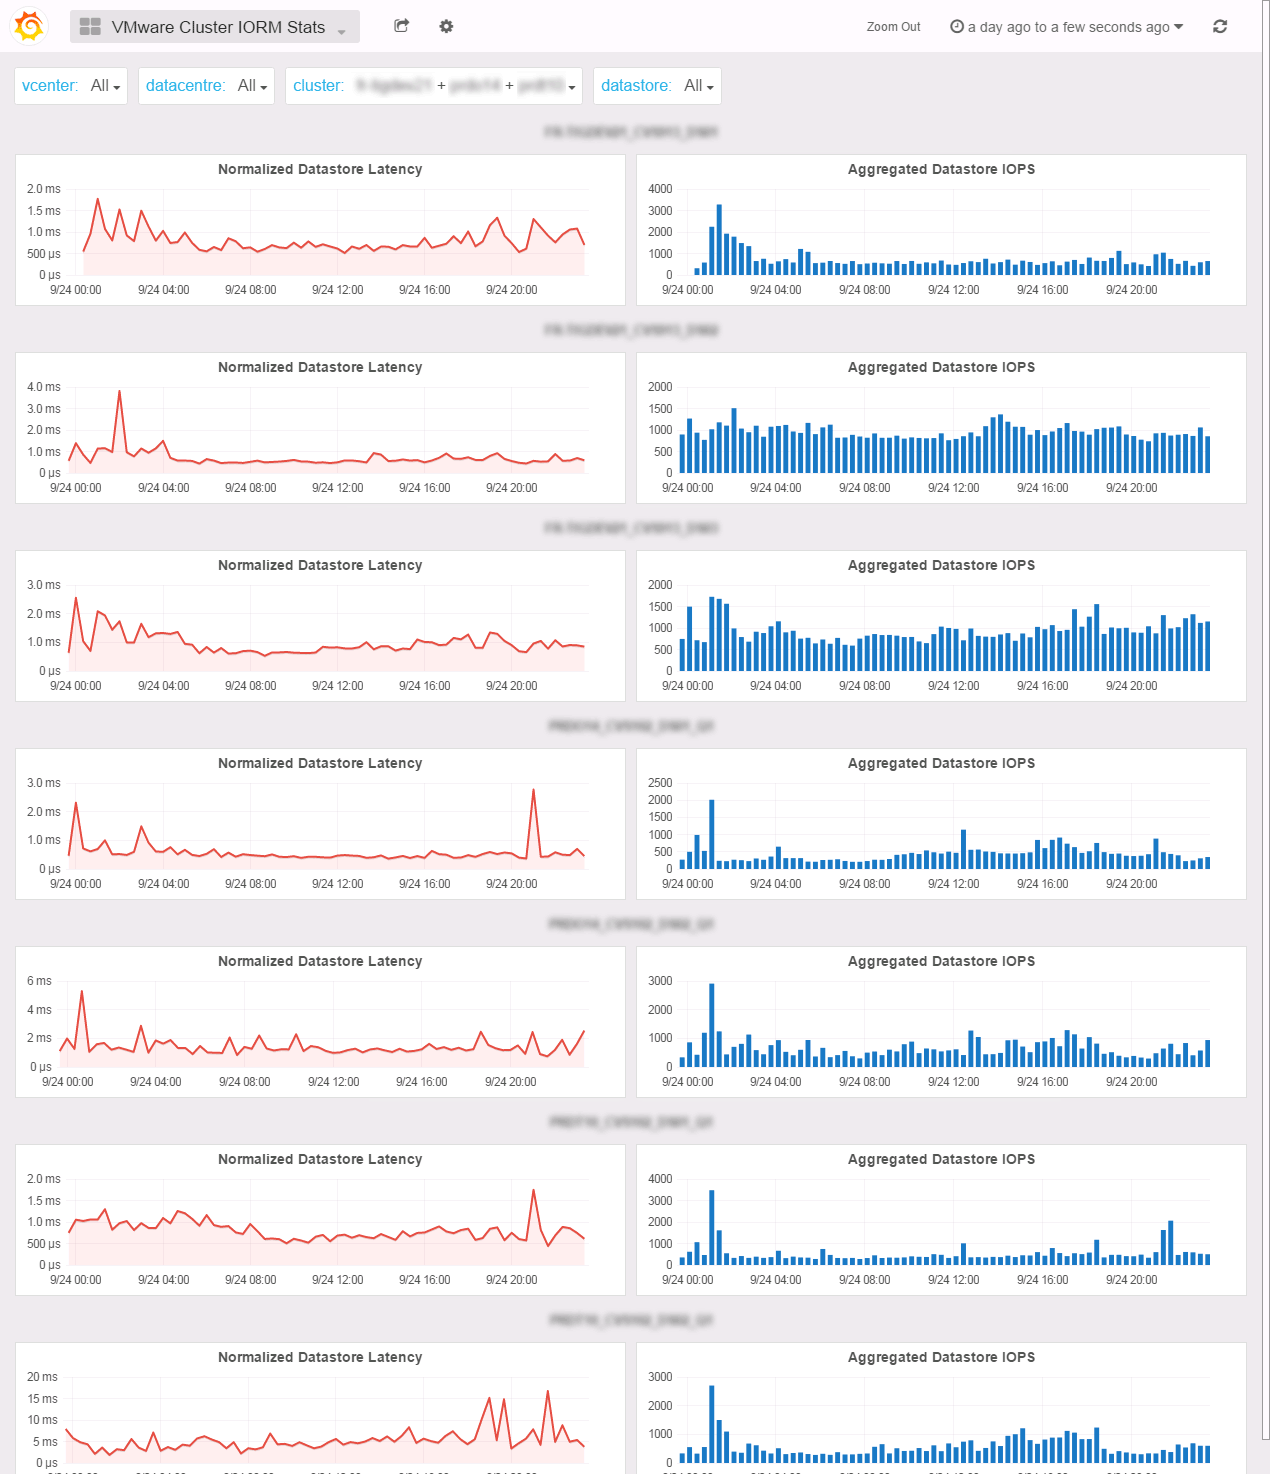
If you need to aggregate clusters, you want to use the Multi Cluster IOPS Stats dashboard and select the clusters you want to participate in the graphs.
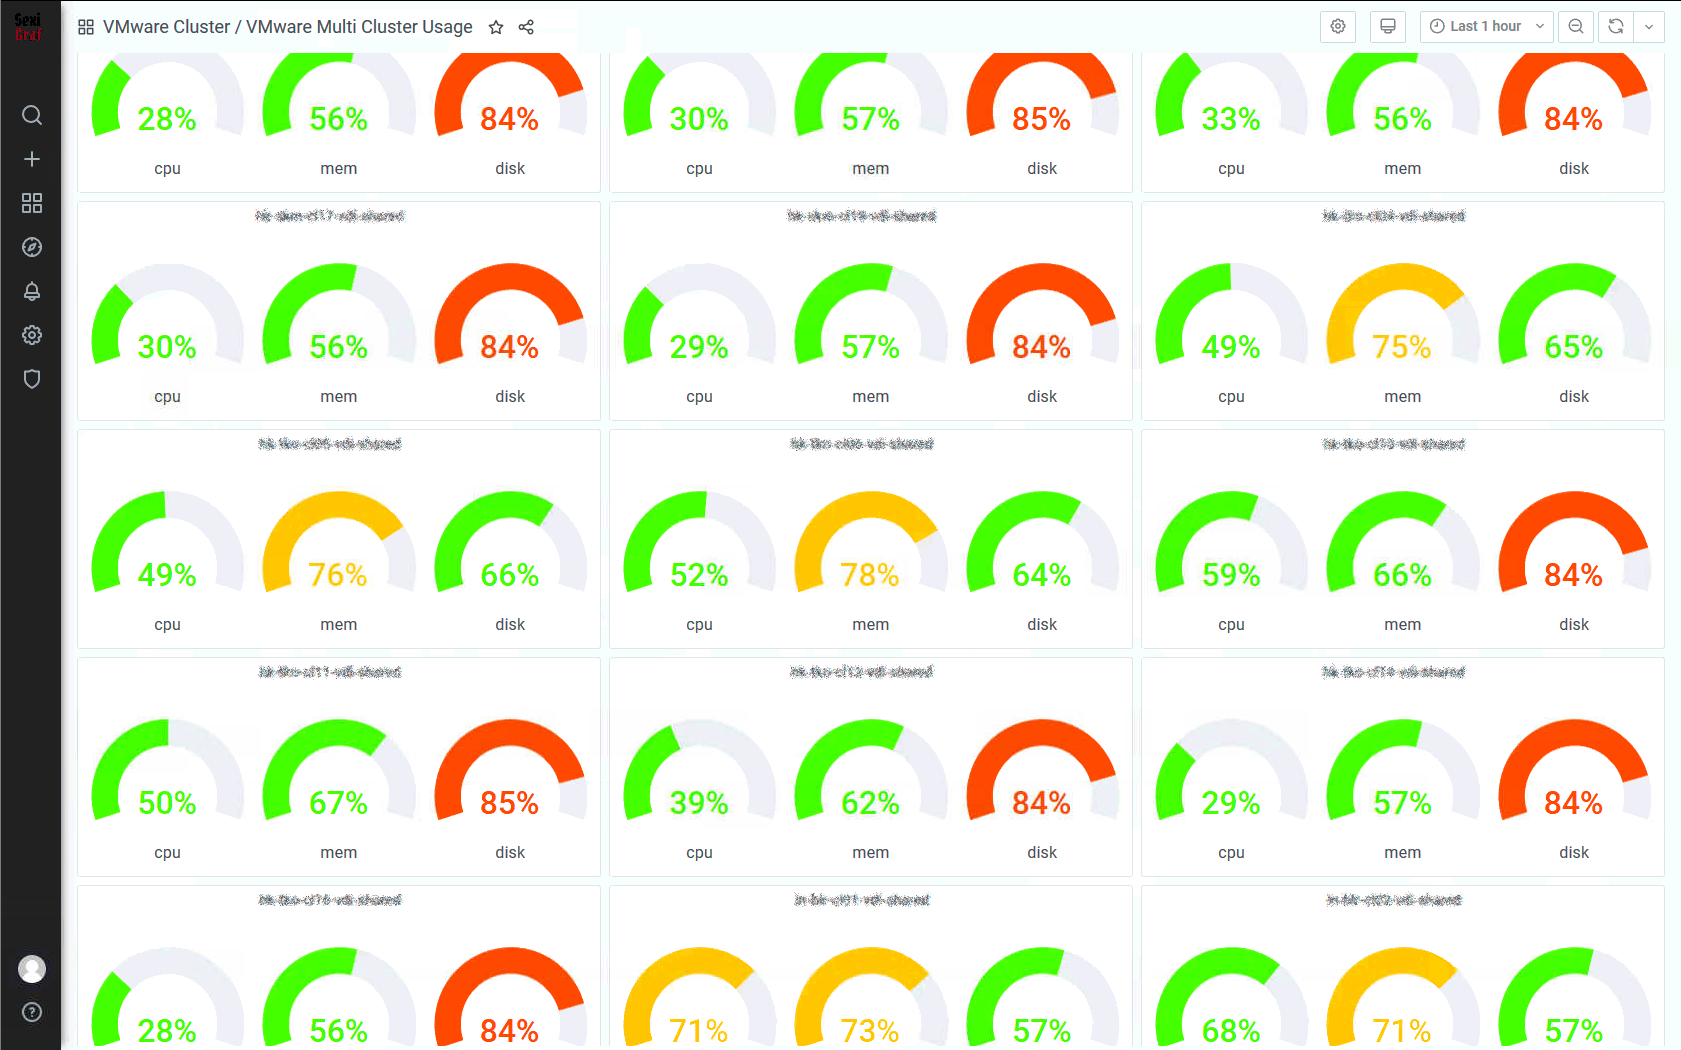
Multi Cluster Usage
This dashboard has been totally redesigned in version 0.99g so now you can see exaclty what resource is under pressure in your clusters.
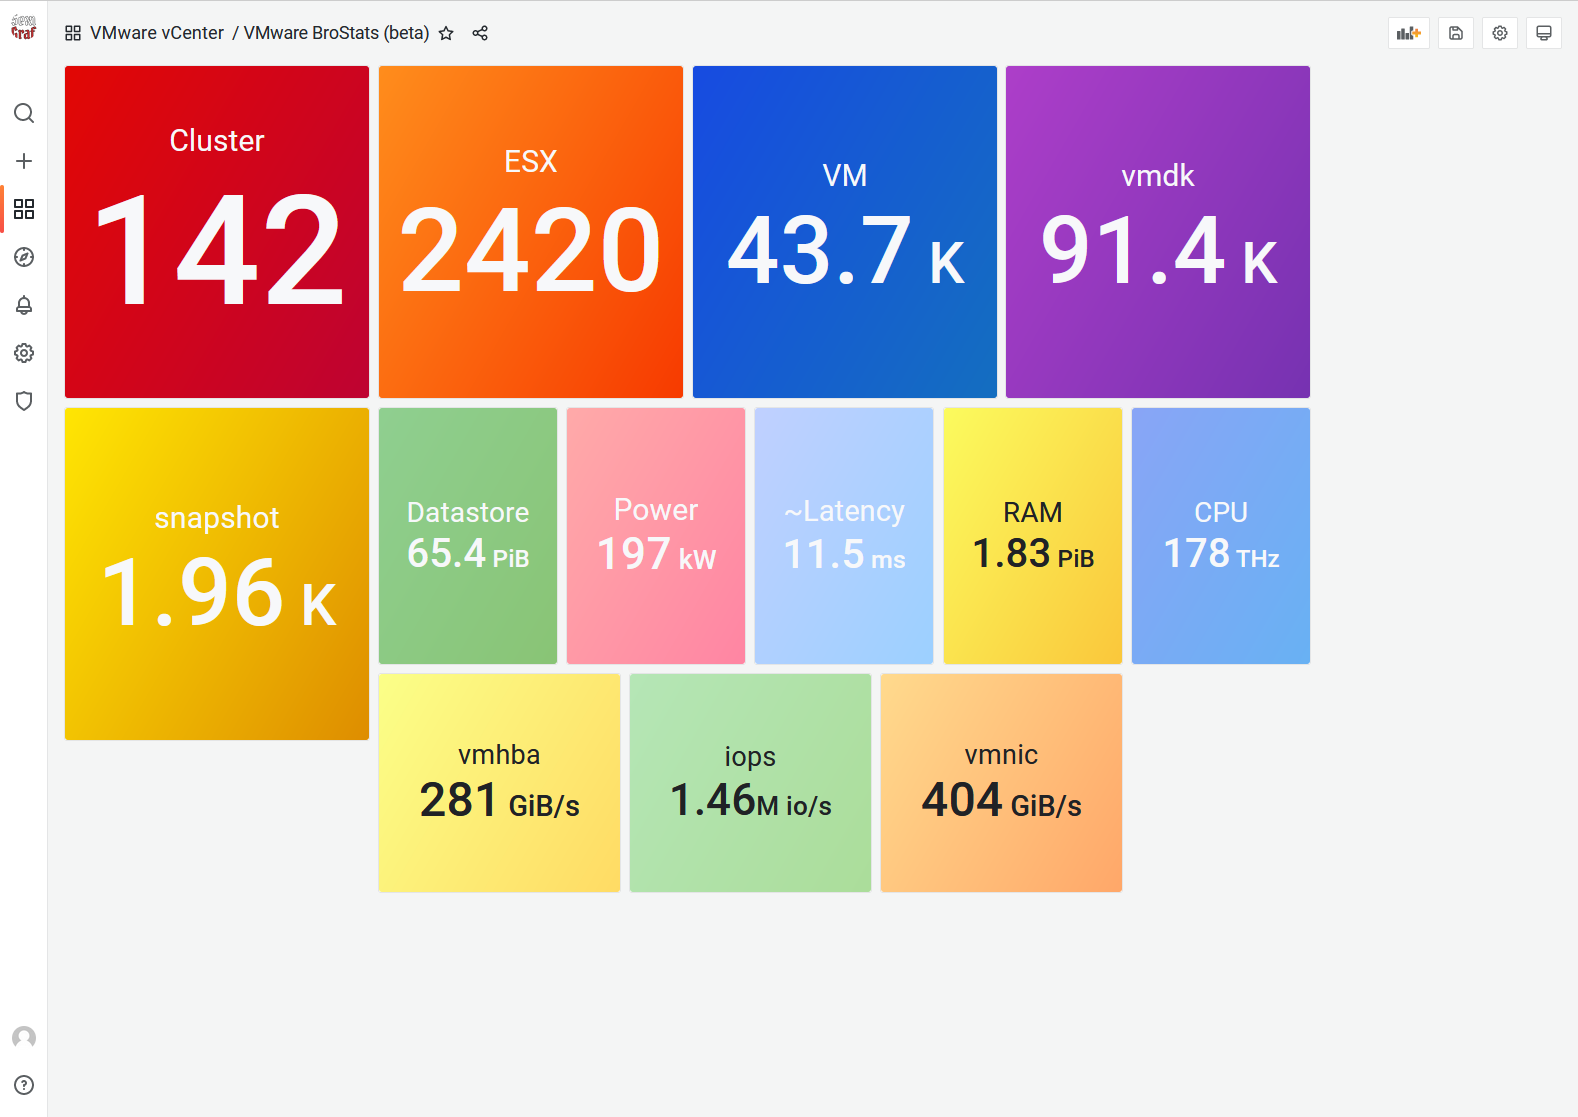
BroStats
Currently in beta, this dashboard replace the infamous FlambX dashboard since SexiGraf 0.99h and as the name suggests, it’s about measuring your big stats and compare with others.
Multi Cluster QuickStats
If you need to compare the basic compute and storage metrics between your clusters, this is the dashboard you’re looking for.
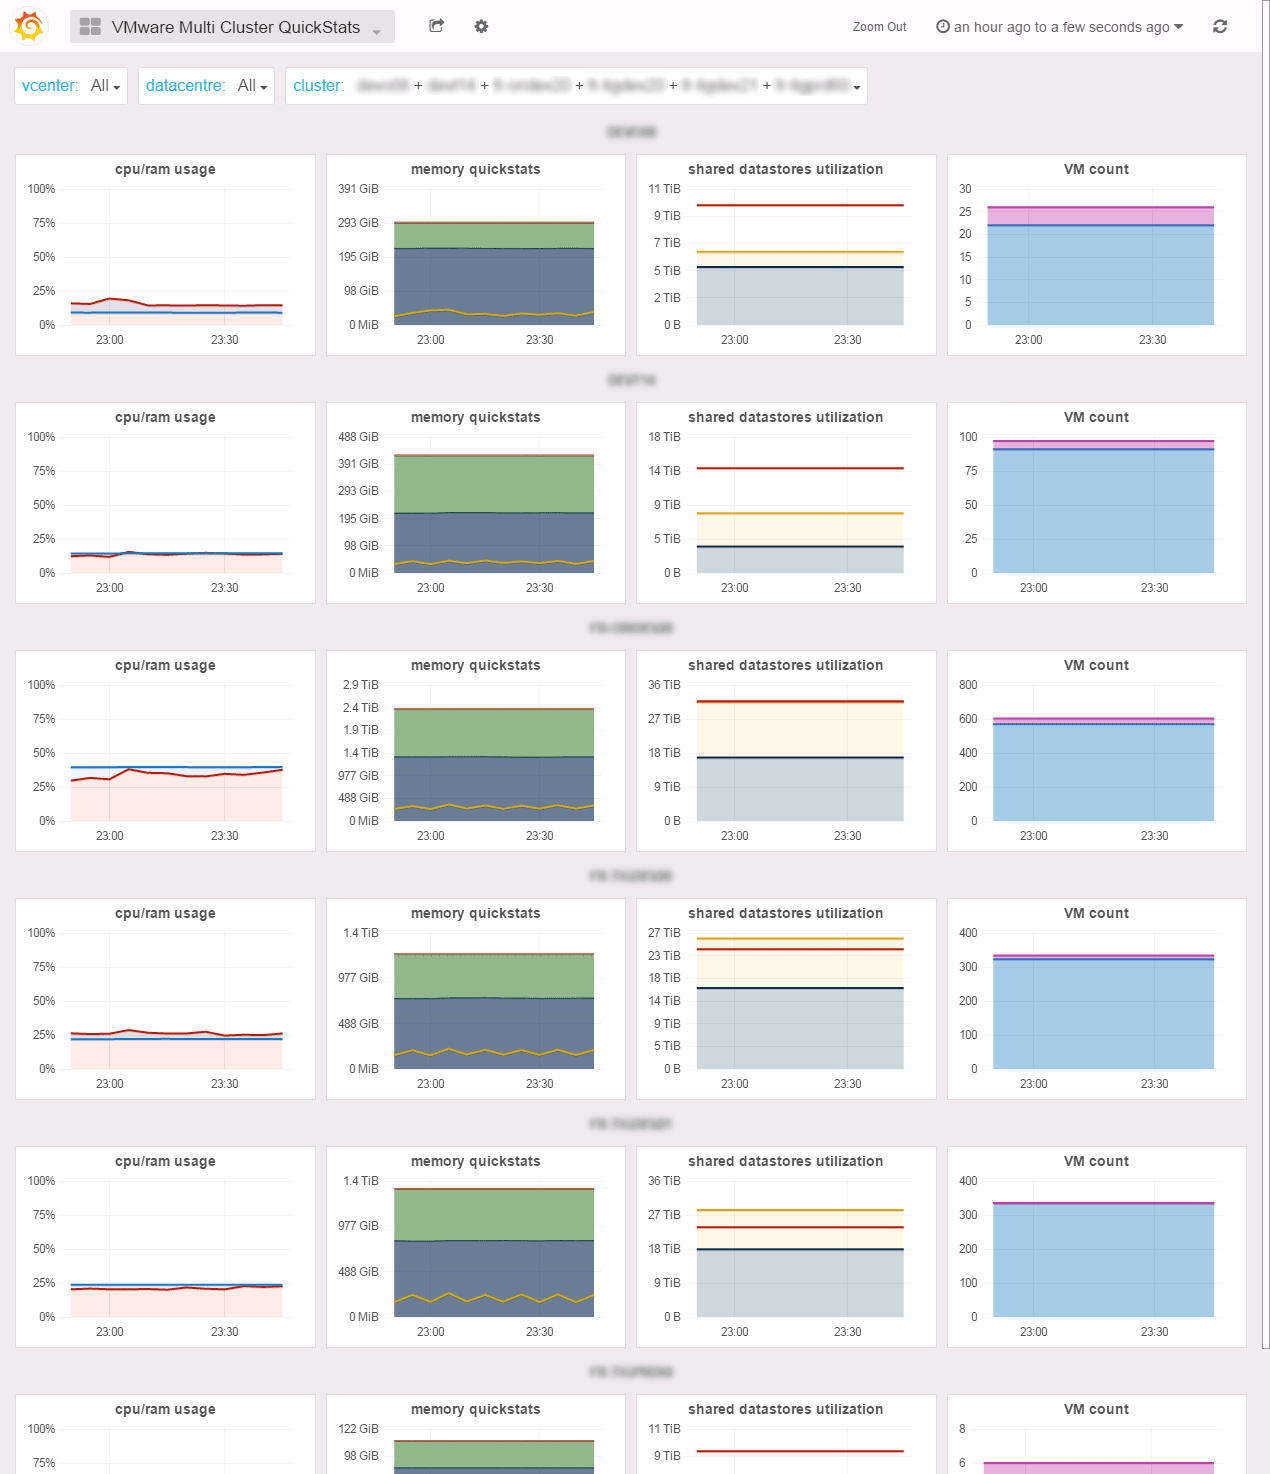
If you need to compare standalone ESX, it’s the Multi ESX QuickStats.
Multi Cluster vMotion
The vMotion frequency is a very useful indicator of the cluster compute resources availabilty for your VMs. If you witness a lot of vMotions in one of your cluster, you may want to evacuate VMs, add resources or change the DRS migration threshold to a more restrictive level.
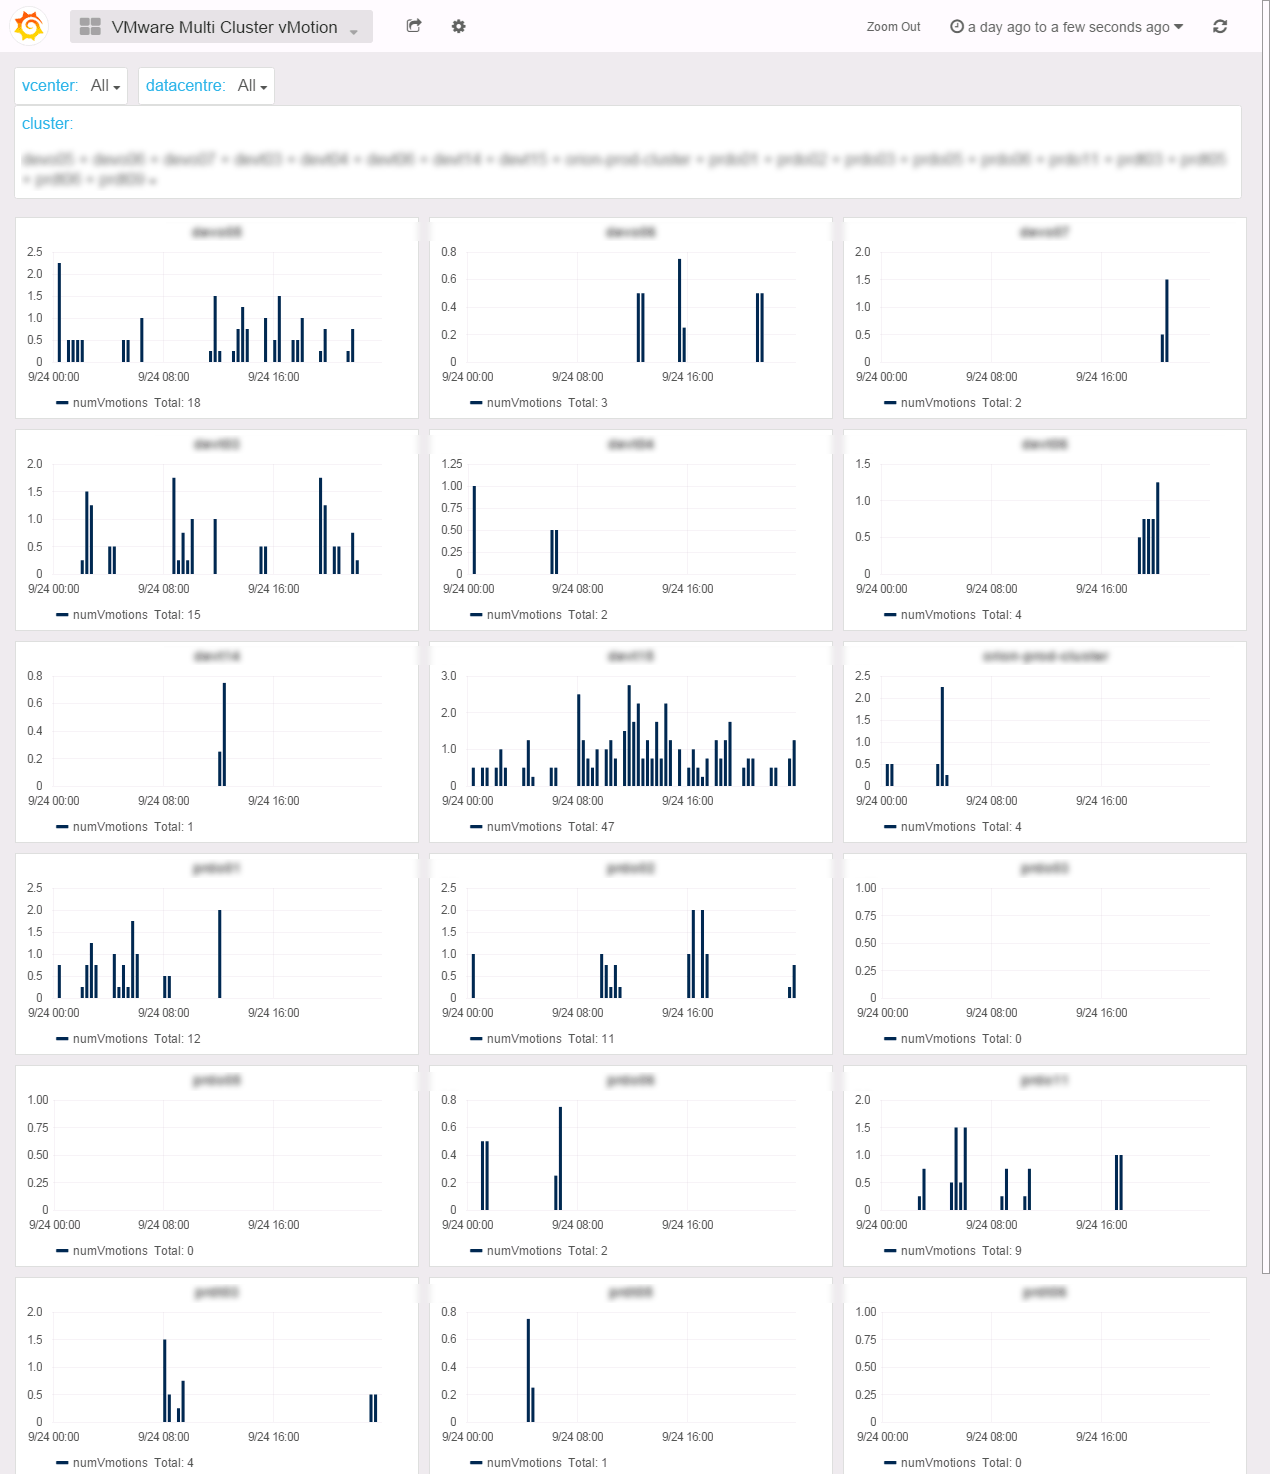
In 0.99g version we’ve added svmotion count and since 0.99h you also got xvmotions.
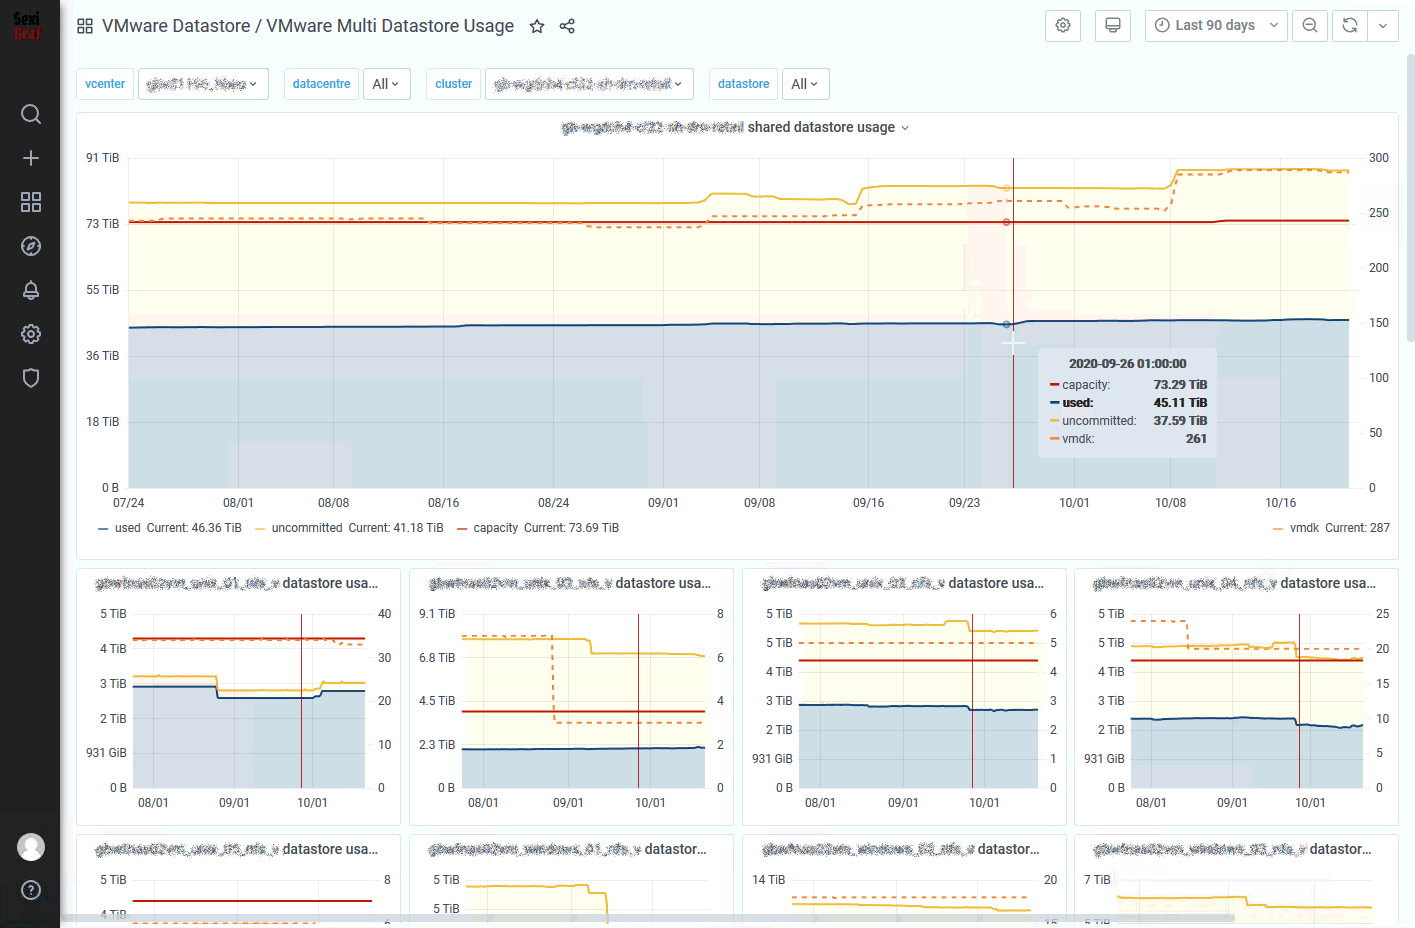
Multi Datastore Usage
You got a mail from your boss asking you a storage report to plan the next storage array migration? Just go the Multi Datastore Usage dahsboard, pick the target clusters and send him a screenshot. It only took you 15sec. Or maybe you’re just curious about the overall storage overcommit of your VDI infrastructure. The big graph a the top is the aggregation of every selected datastores of the selected clusters displayed in the small graph at the bottom.
In 0.99g version we’ve added vmdk count per datastore.
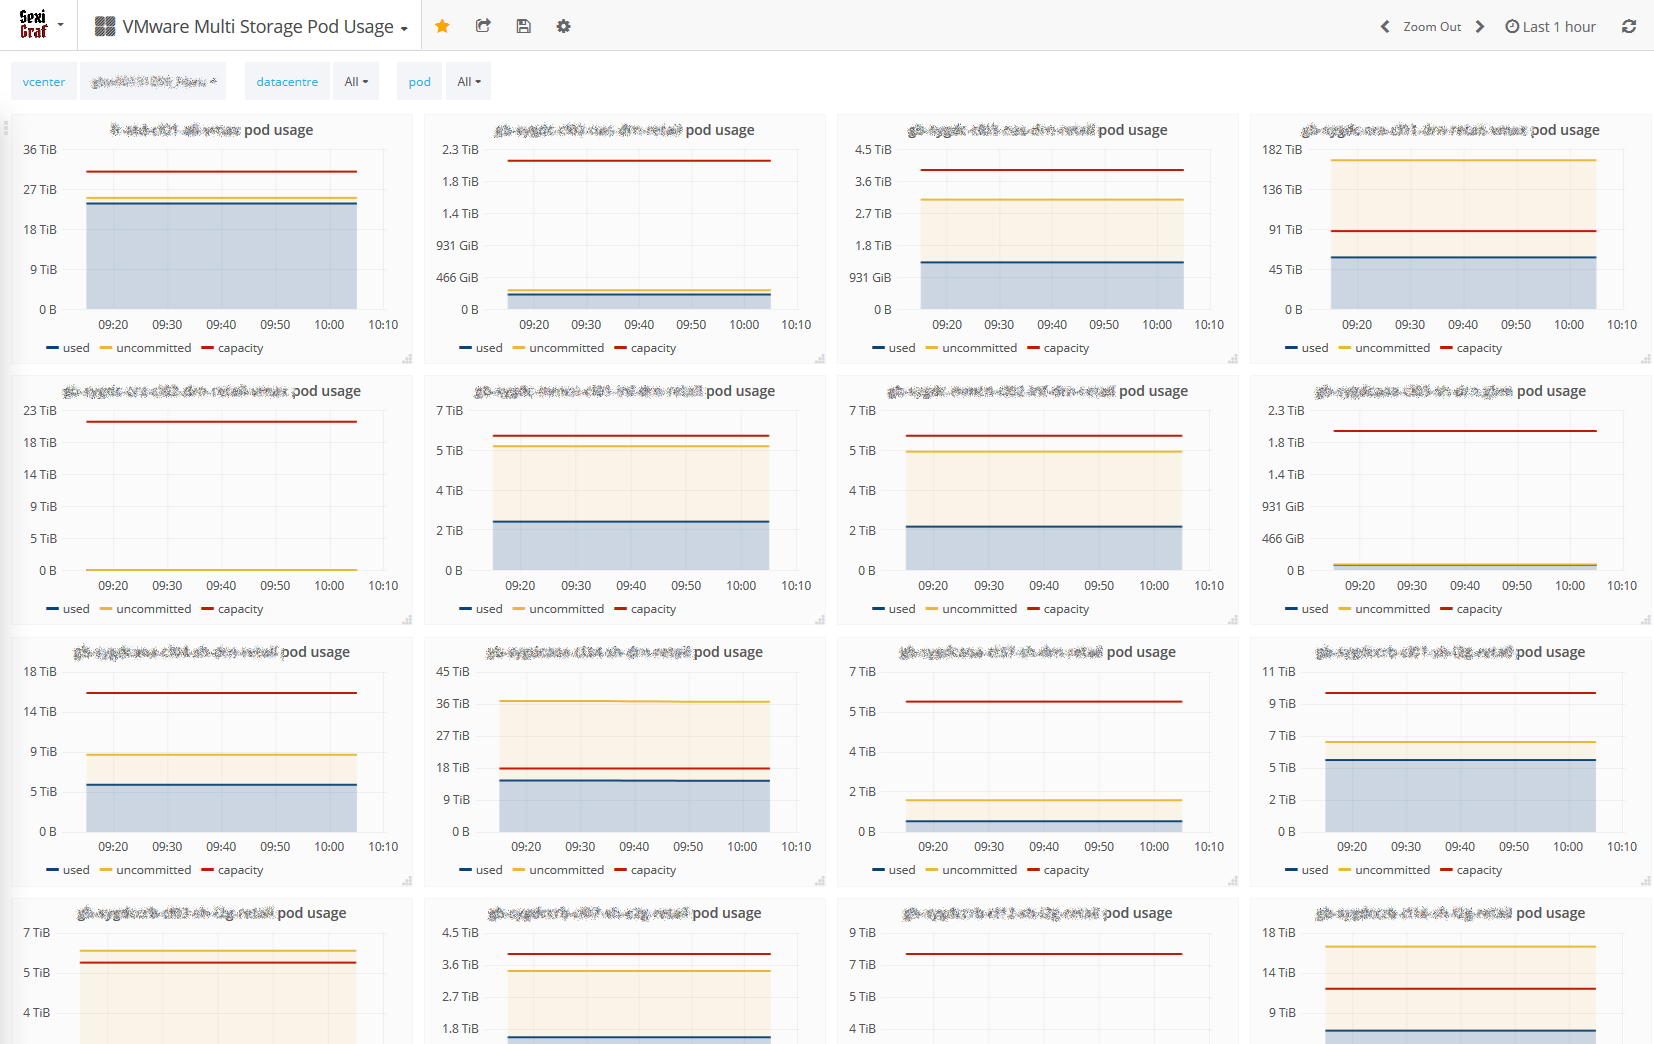
Multi Storage Pod Usage
Using Storage Pod aka Datastore Cluster? In SexiGraf 0.99f we’ve introduced an early Storage Pod Usage dashboard with a computed uncommitted metric from the child datastores, very handy. We called it “early support” because we didn’t linked the pods to the clusters but to the datacenters because it’s the way it is in the VMware API world, you can have a pod for many clusters. So until we figure out a smart way to do it, we’ll stick to that. We’re sure you’ll love it anyway 😉
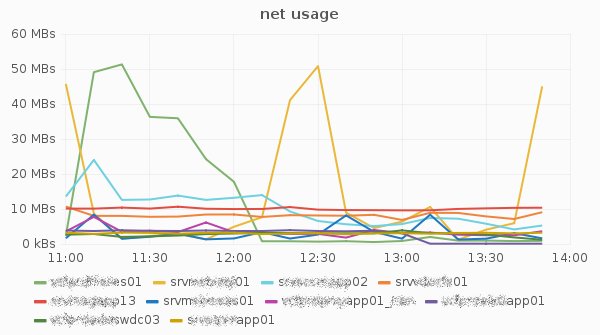
Cluster Network Usage
This dashboard allows you to compare the selected vmnic of the selected ESX in your favorite cluster. If this cluster is contained in a blade enclosure, you’re now able to check what is going in and out from your chassis. Noticed the cacti style of the graphs?
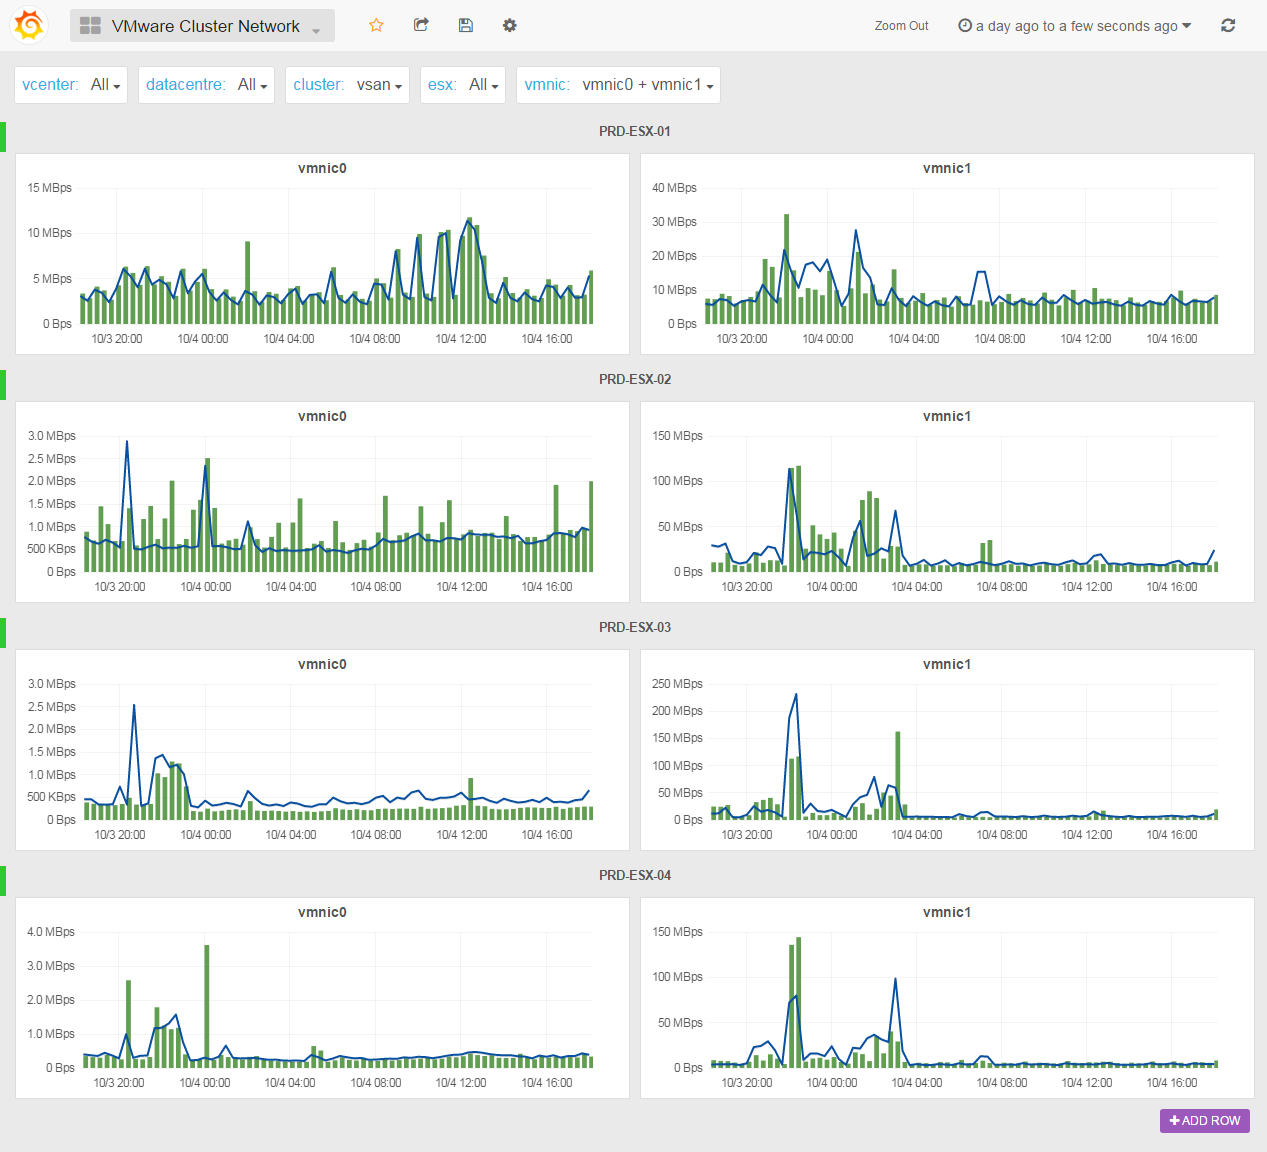
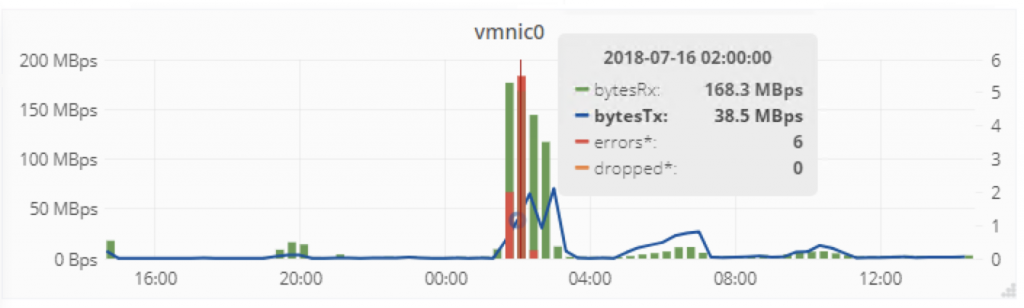
In version 0.99e, we’ve added the droppedTX, droppedRX, errorsTX and errorsRX counters (on the right Y axis) so can have a bit of history for those metrics in your favourite tool:
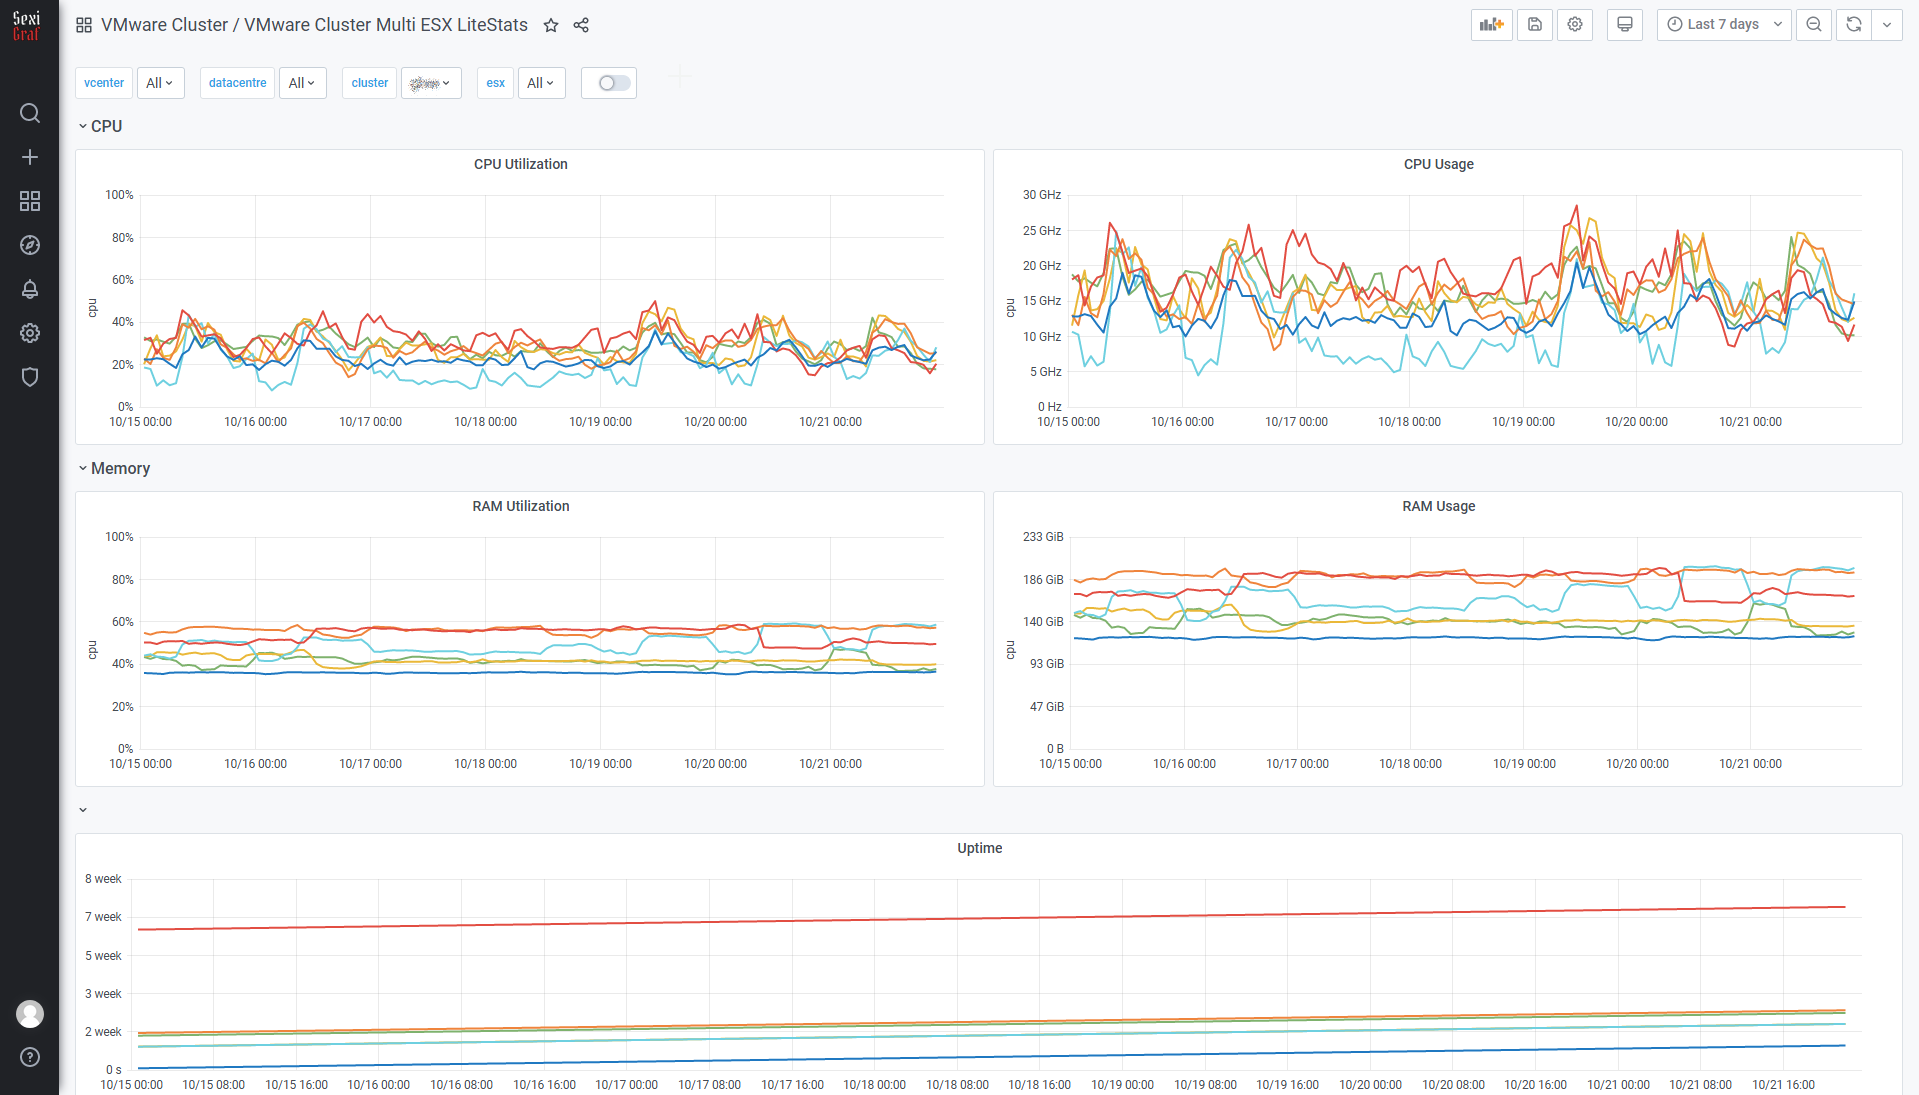
Cluster Multi ESX LiteStats
This dashboard has been totally redesigned in version 0.99g so now you can see the usage in percentage or mhz/mb and the uptime on the same graph.
All Cluster Top N VM Stats
Starting from SexiGraf 0.99b you can monitor the top N VM quickstats* (1 to 20 VM per graph). Now you can find the bad *sses of your datacenters!
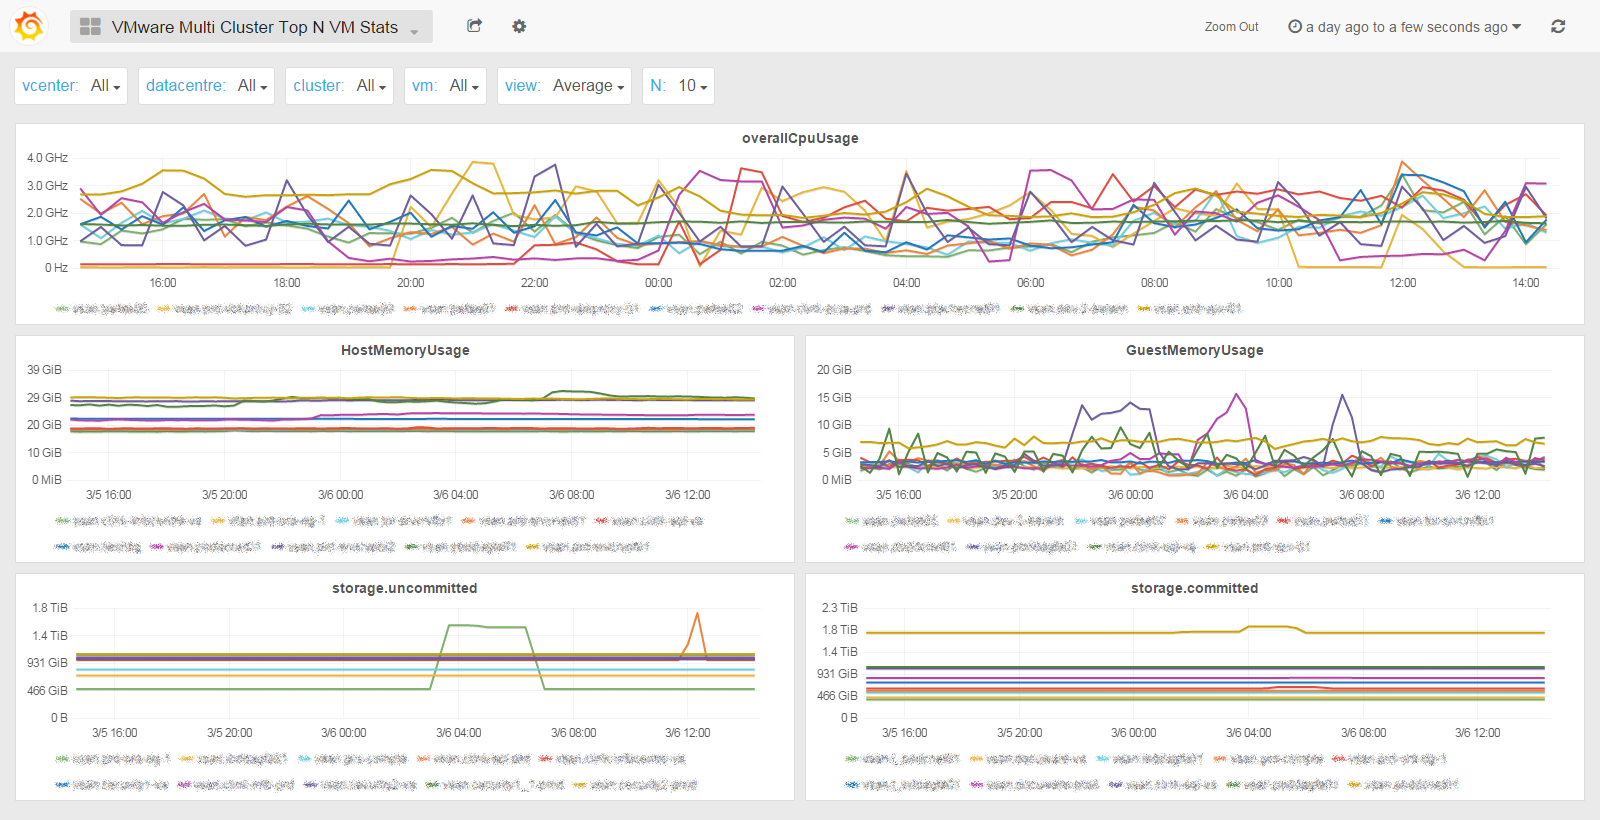
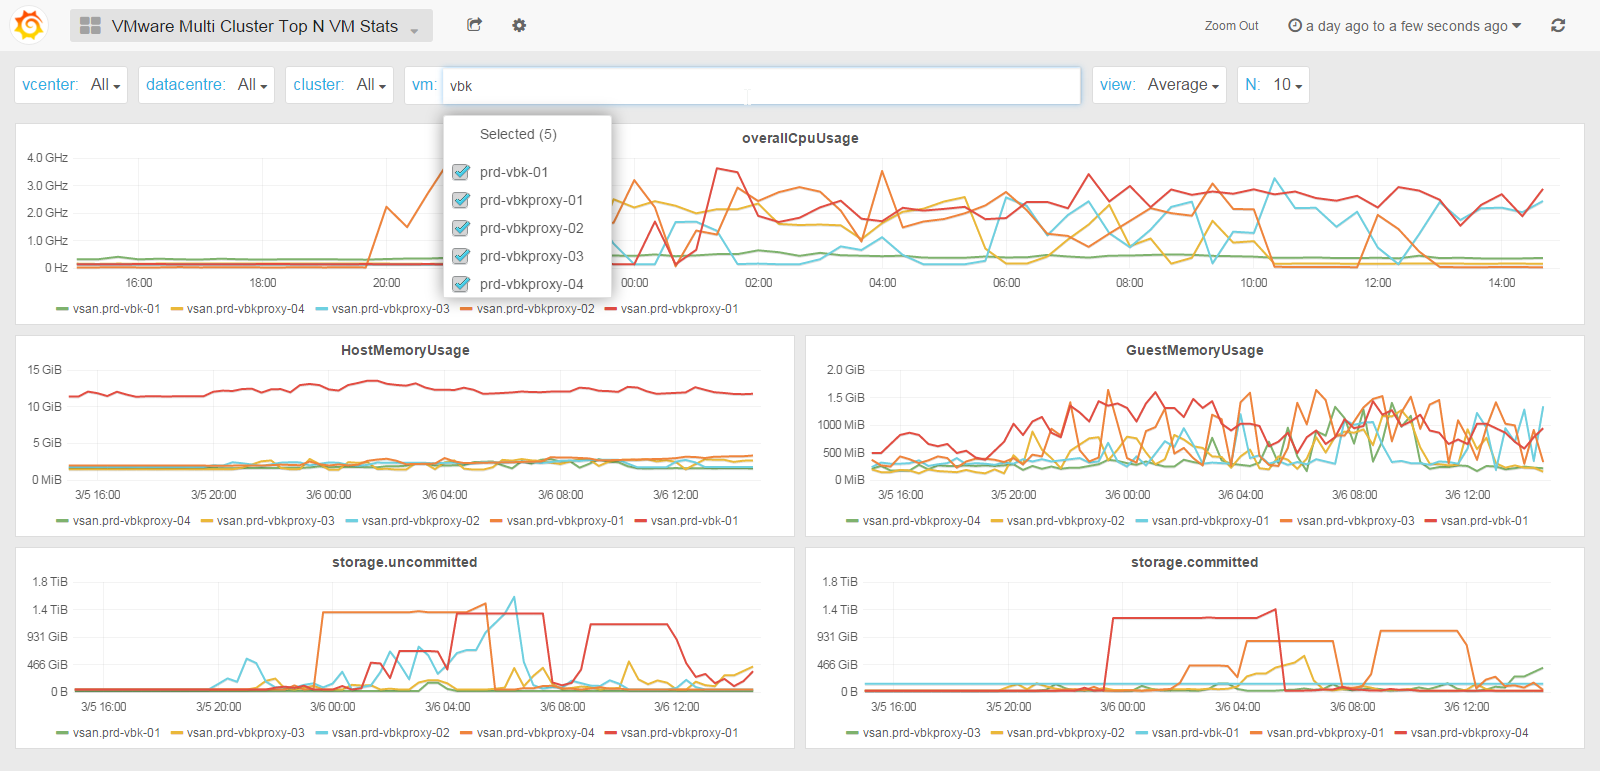
Of course you can also search and pick some VM of your choice to compare their stats. The legend is formated as such to help you locate any tango: <cluster_name>.<vm_name>
In the SexiGraf 0.99d release, we revisited this dashboard to add snapshot usage (storage.delta), CPU & MEM usage in %, the world famous CPU Ready metric (aka %RDY), CPU Latency (aka %lat_c) and maxTotalLatency. Now you can check everything about all or some specific VMs in a single pane of glass:
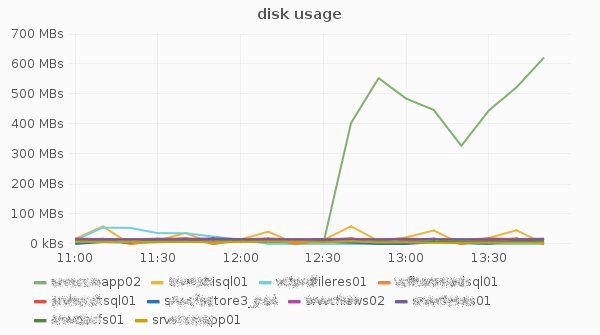
In version 0.99e, we’ve added vm network and disk usage:
In version 0.99j, we’ve added the higly requested VM IOPS metric:
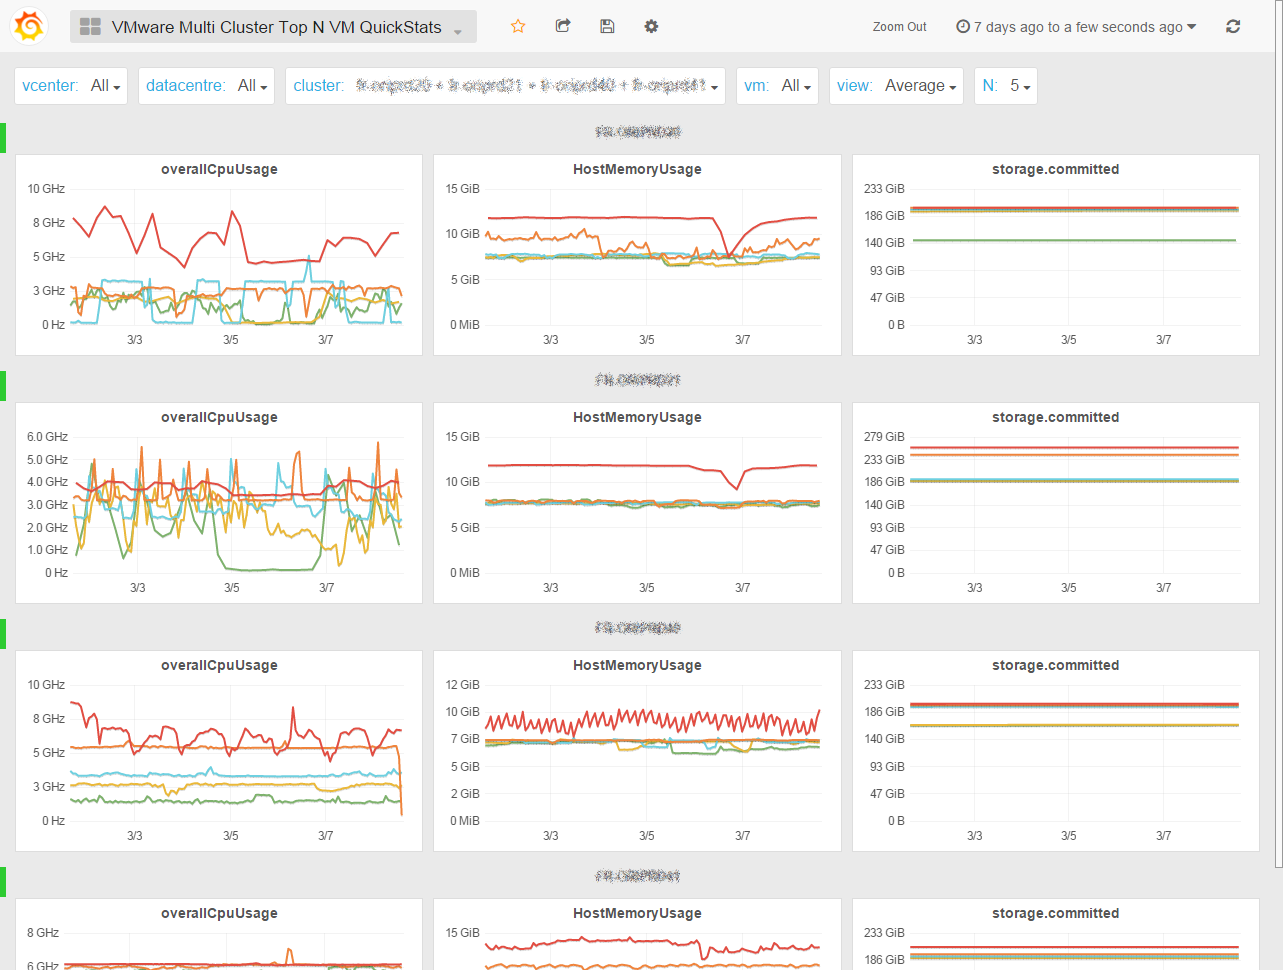
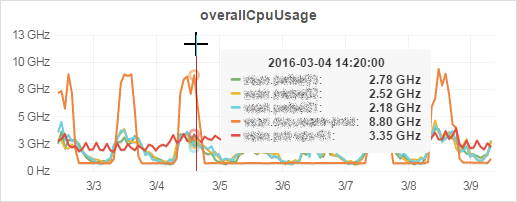
You may want a top 5 VM per cluster instead? We did that too 😉
Check out the Multi Cluster Top N VM QuickStats dashboard and simply slide over to reveal the usual suspects:
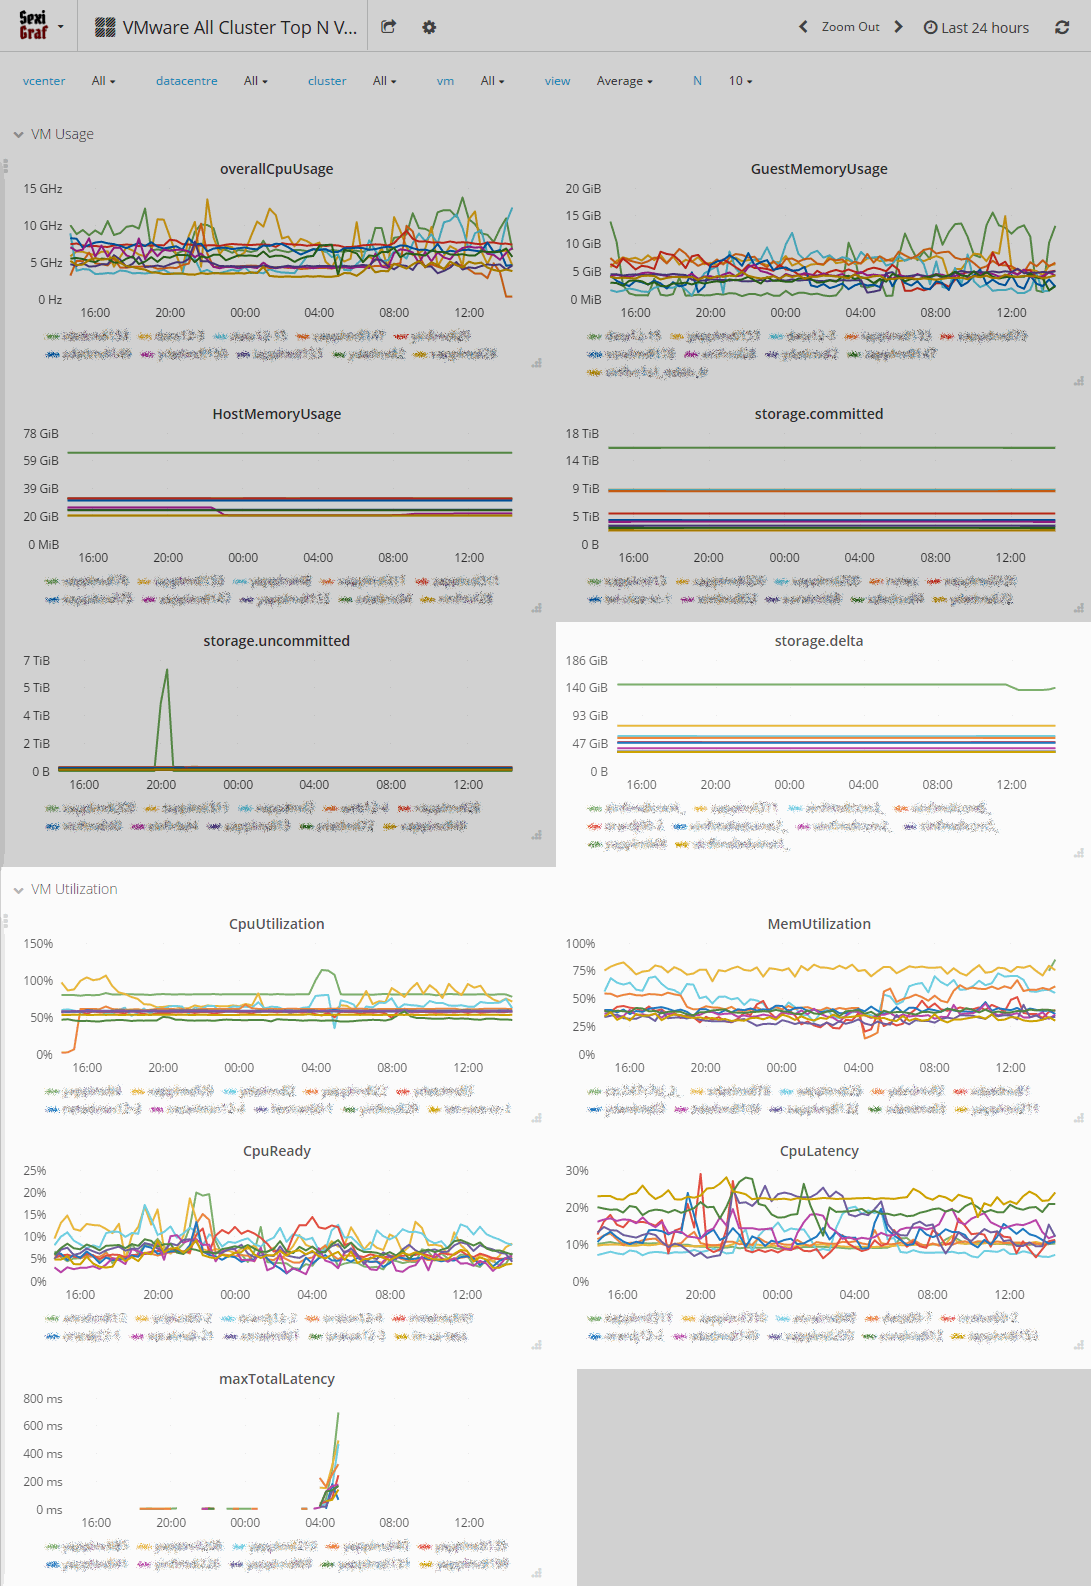
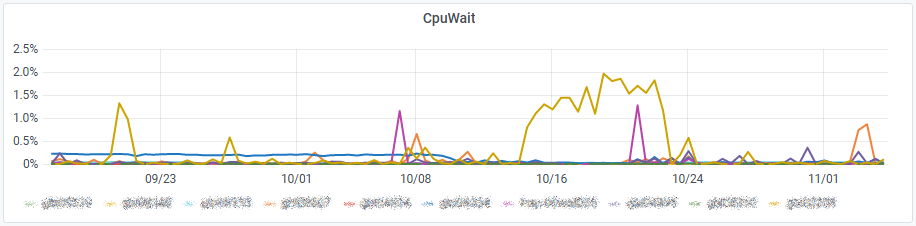
In SexiGraf 0.99f, we’ve added a variant of that dashboard with overcommit metrics but without the Top N feature for those with big inventory just wanting to compare a bunch of VMs: VMware All Cluster VM Stats
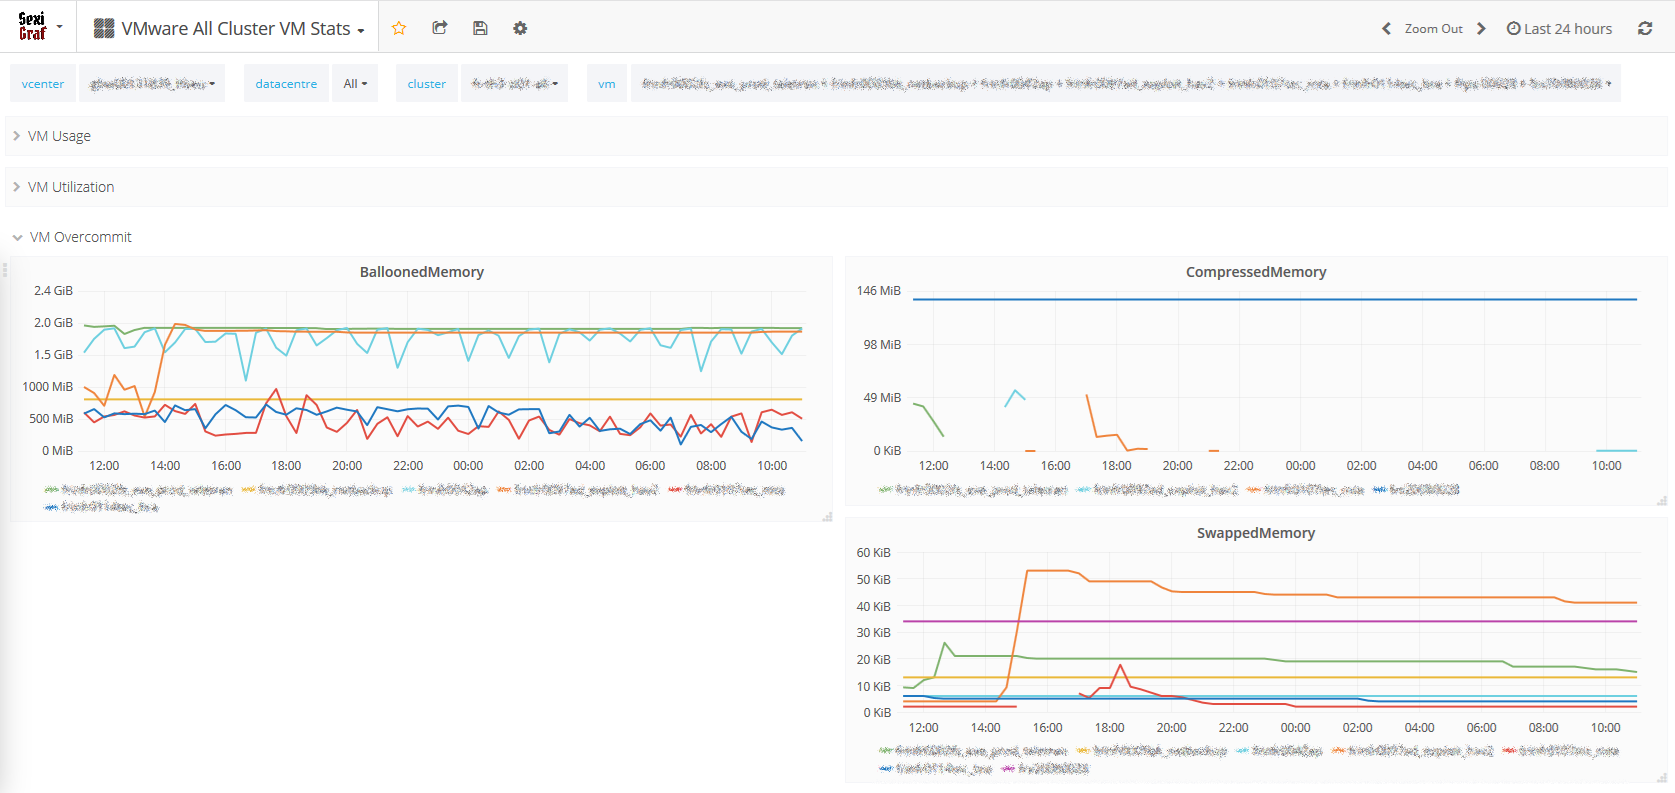
In version 0.99g we’ve added CPU Wait metric from which we deduced CPU idle metric in order to only keep the I/O wait : “The wait total includes time spent the CPU Idle, CPU Swap Wait, and CPU I/O Wait states.“
Multi Cluster Top N VM Overcommit
We could have added those graphs in the Top N VM Stats dashboard but we wanted to kept the bad and the ugly apart from the good. Since SexiGraf 0.99b you can also monitor the top N overcommited* VM (1 to 20 VM per graph).
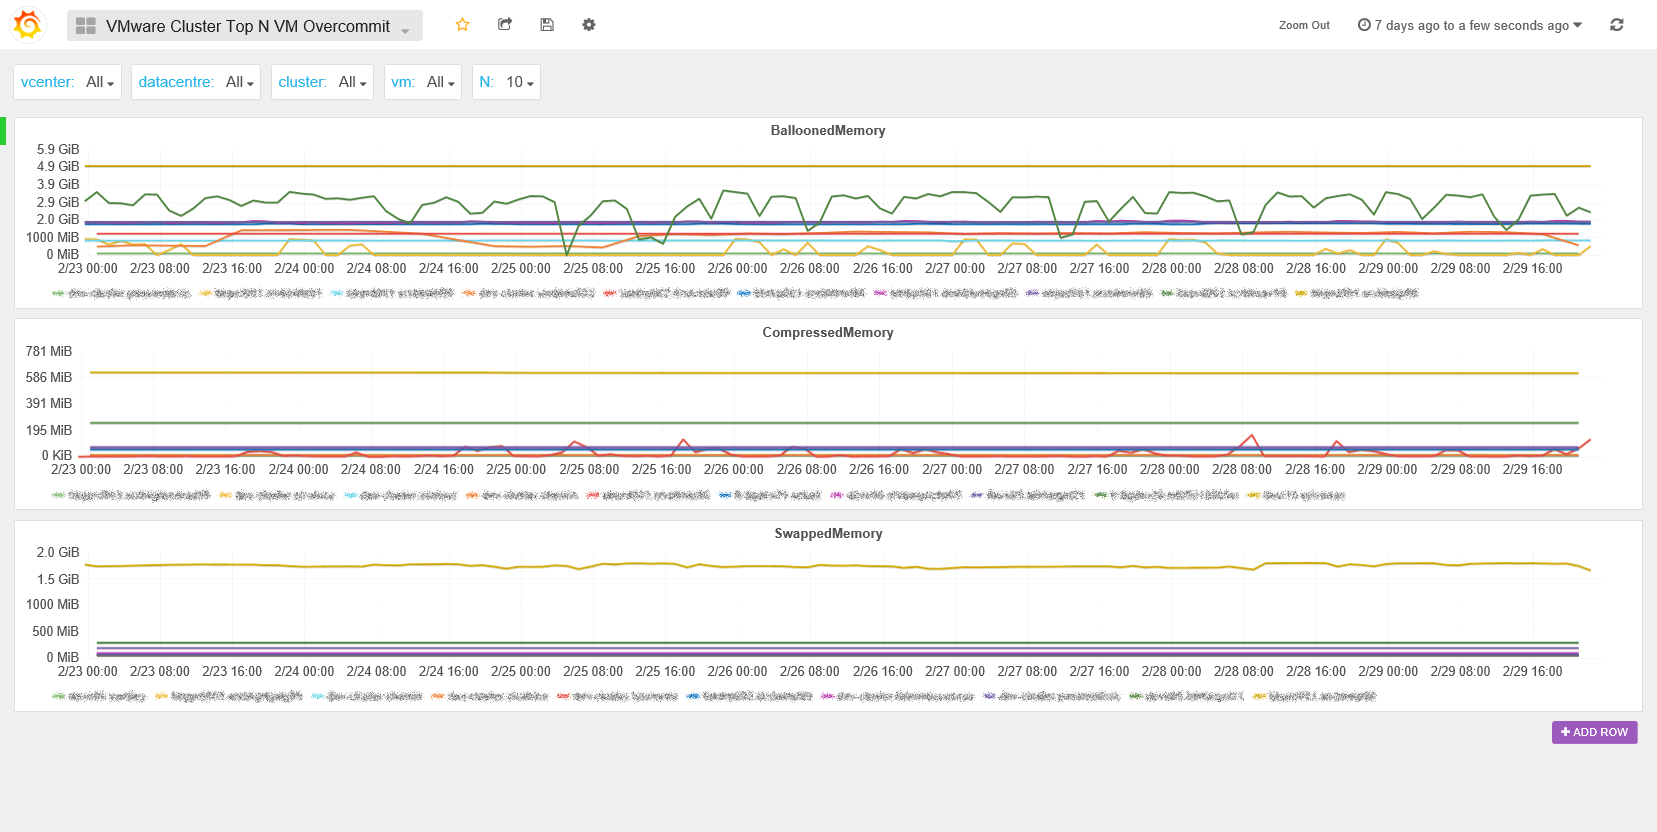
This dashboard will help you to identify situations like memory limits, vm that have been in contention in the past with remaining zipped/swapped pages or idle tax.
* The graph names match the Counters names of the Performance Manager to let you dig into the details if you want to.
Multi Cluster Top N VM Snapshot
In the history of VMware monitoring tools, SexiGraf 0.99d is the first to introduce VM snapshots monitoring:
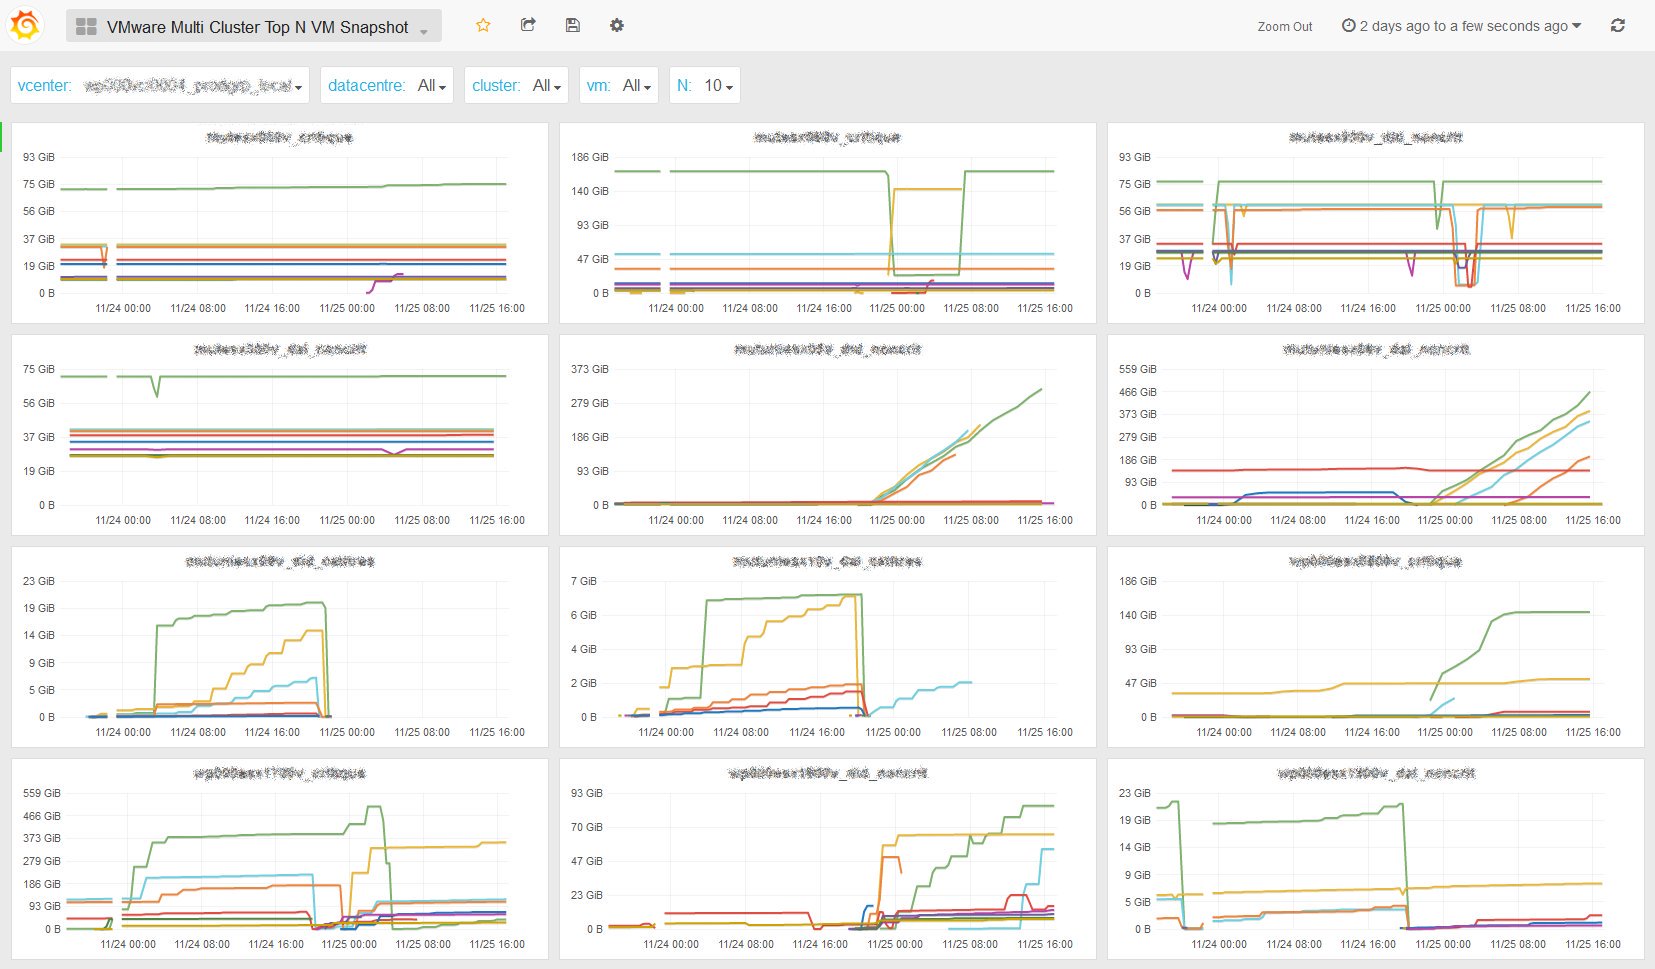
Now you can analyze what’s happening during your backup window and monitor with a surgical precision, per cluster, the snapshot size evolution of your VMs. With this new dashboard, you won’t miss ANY forgotten snaps EVER!
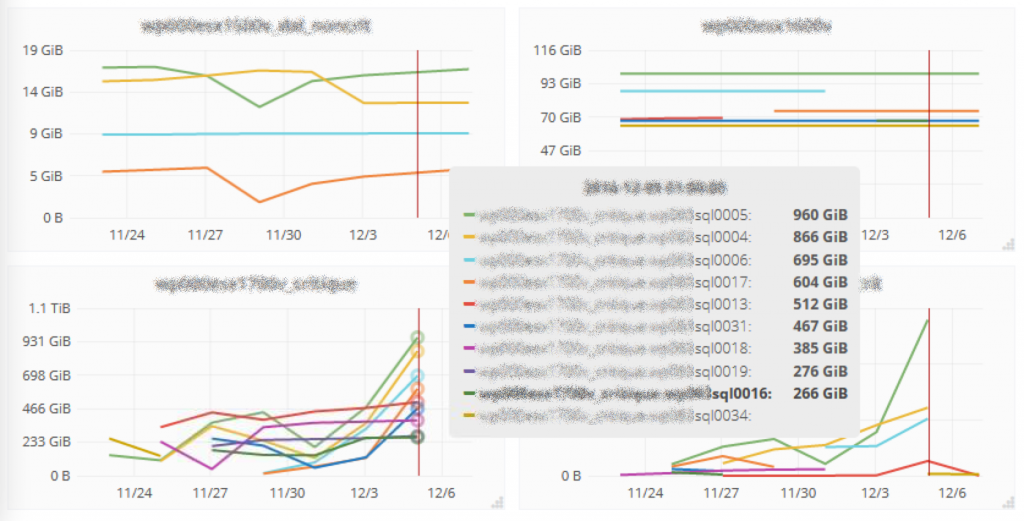
And since we leverage the parent property of the vdisk objects to determine if it’s a real snapshot (or a vdisk with a funny name), you can also keep track of the hidden snapshots (aka non-consolidated) with this dashboard.
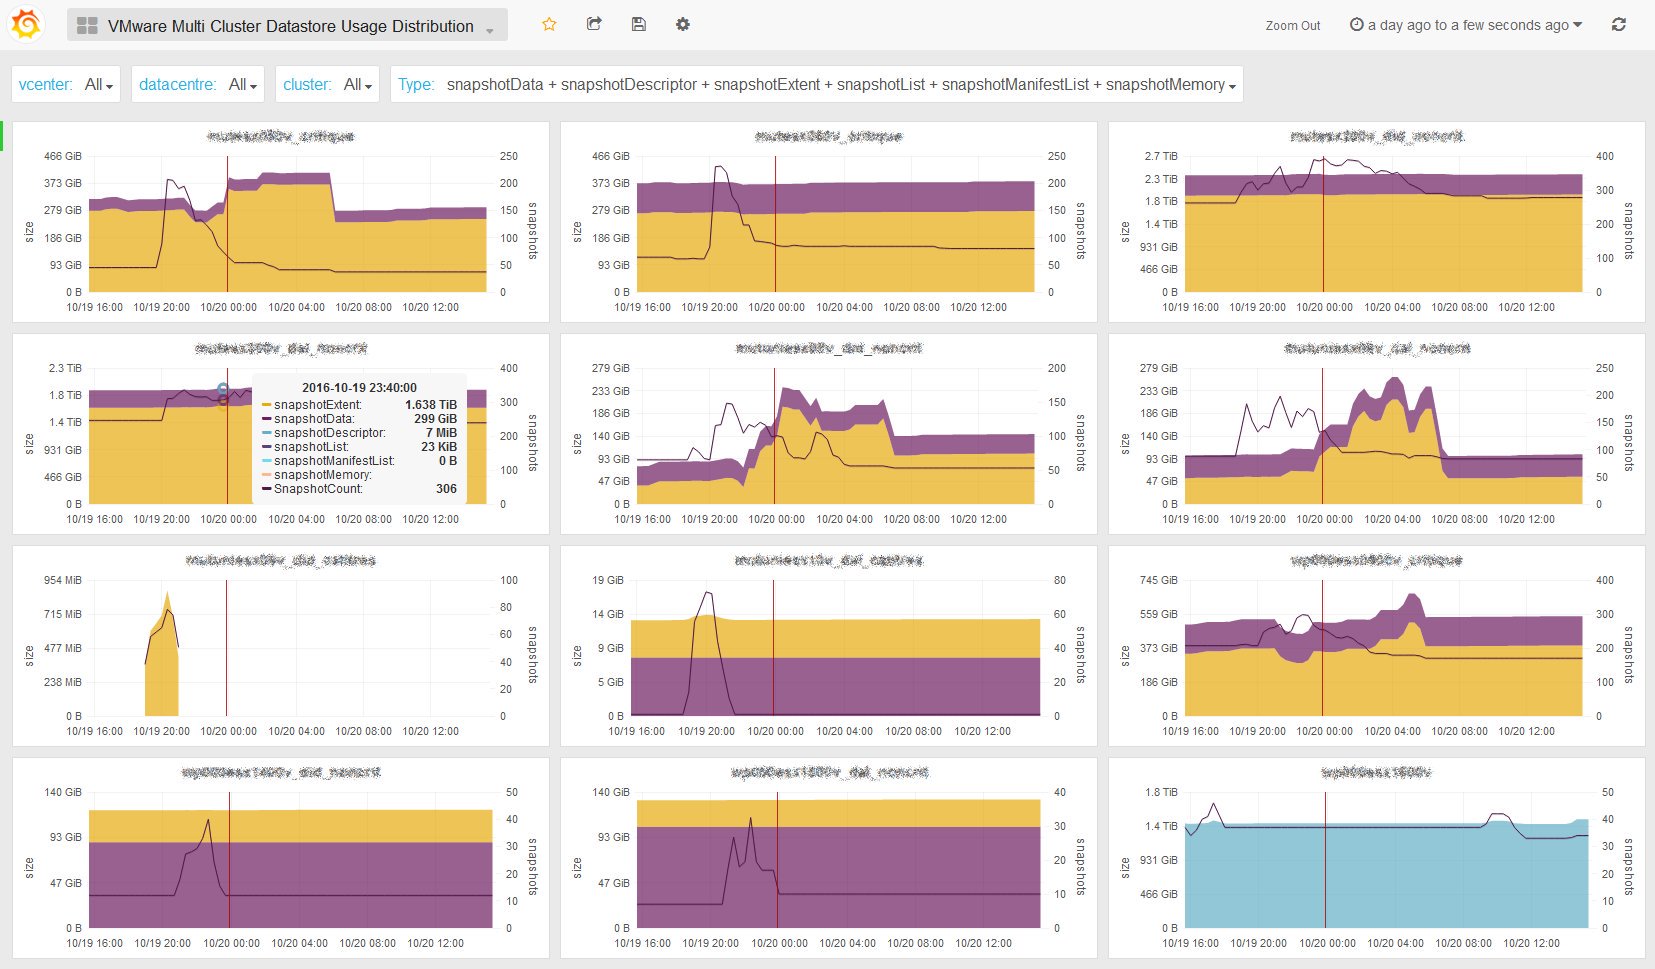
All & Multi Cluster Datastore Usage Distribution
Ever Wonder what your datastores are full of? How much swap and snapshots are consuming per cluster?
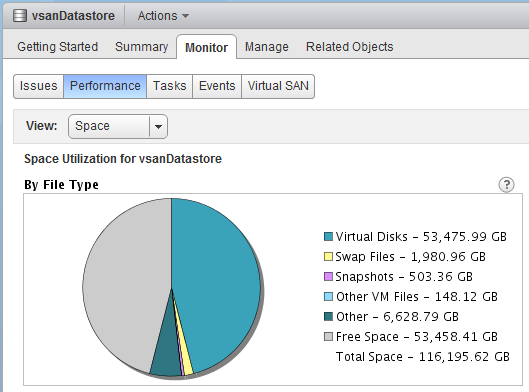
Since SexiGraf 0.99d the Multi Cluster Datastore Usage Distribution dashboard let you monitor the datastore usage per filetype like the old-shool VMware pie chart but Harder, Better, Faster, Stronger and at the cluster level:
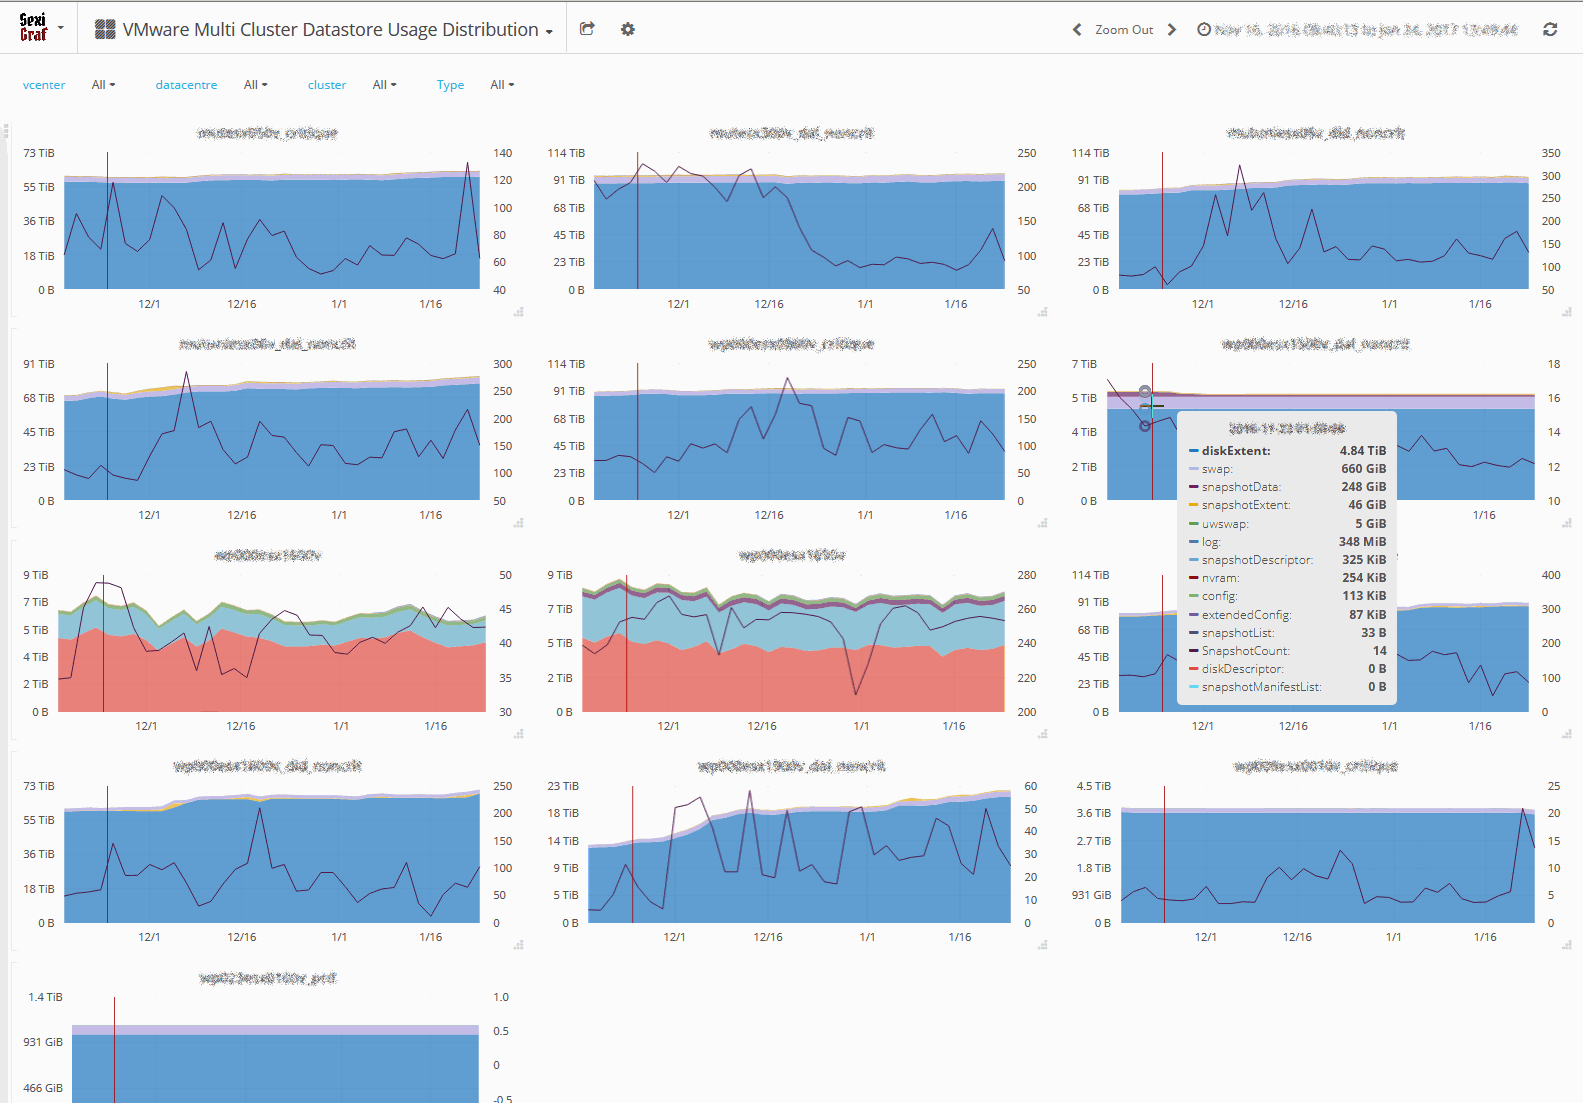
Because the Disk extent (-flat/-delta/-s/-rdm/-rdmp.vmdk) file VMware File-type was a bit too inclusive, we took the liberty to split it to add new ones like rdmExtent, rdmpExtent, snapshotExtent and snapshotDescriptor. In the future, we also plan to add vsanSparseVariant.
Since we’ve added a FileType selector, you can pick snapshot file types and track the waste space on your entire infrastructure! And just because we know you’d love it, we have also added a snapshot counter on the right Y axis 😉
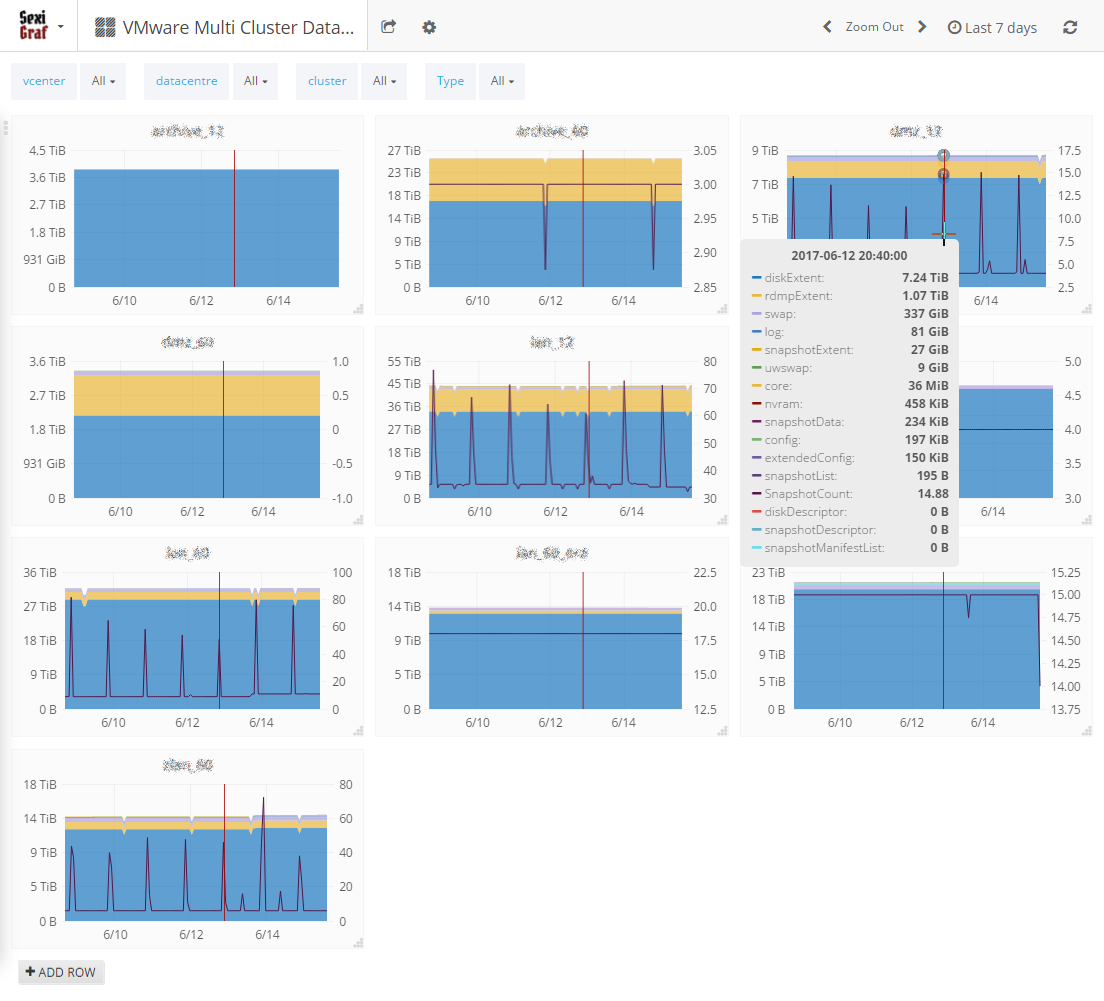
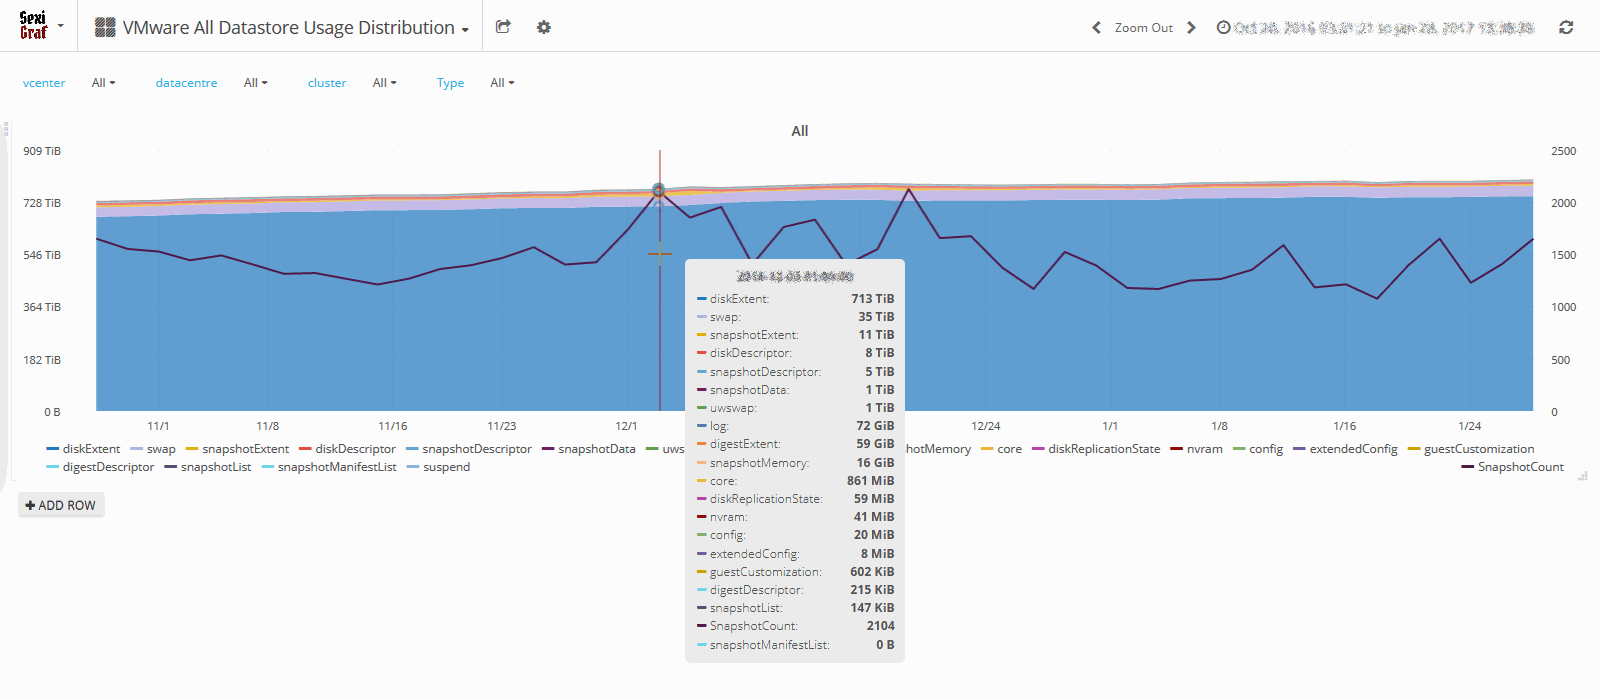
Last but not least, if you need to see the big picture, we also created the All Datastore Usage Distribution dashboard:
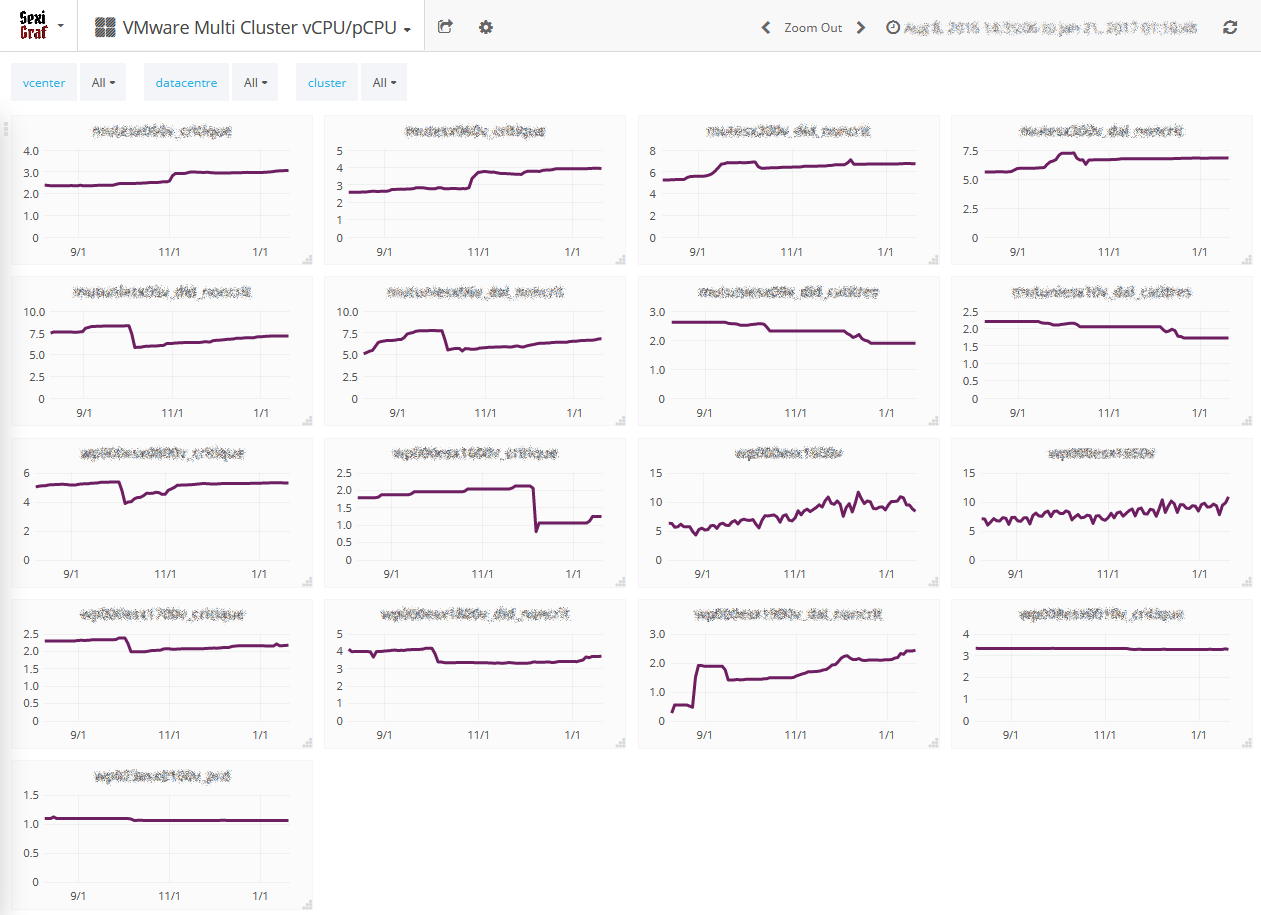
Multi Cluster vCPU/pCPU
Whether you are running application servers or virtual desktops, you need adjust and monitor the vCPU per physical core ratio. Having a bit of history on that metric let you also anticipate incoming needs so you can scale before getting overcommit issues. That’s why in SexiGraf 0.99d we’ve added a new dedicated dashboard in case you need to compare cluster vCPU consolidation ratios:
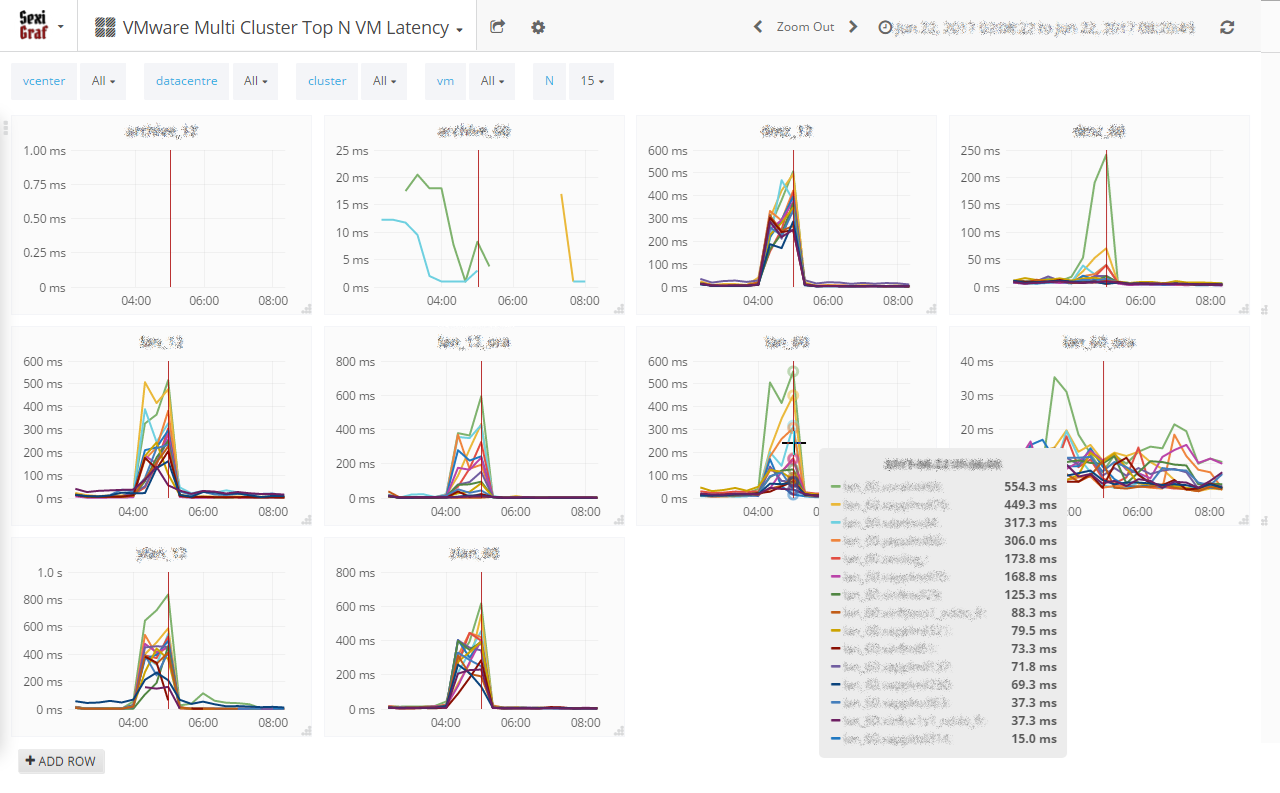
Multi Cluster Top N VM Latency
Storage latency is certainly one of the most critical metric to monitor because of its very unique effect on user perception. See how we could be amazed by NVMe devices for instance (if you don’t know what I’m talking about, stop everything and try one now). The 20 year old post from Stuart Cheshire is still very accurate, It’s the Latency, Stupid!
The very first version of SexiGraf came out with latency metrics of course but at the datastore level. During some troubleshooting involving storage latency, we noticed that sometimes the VM latency was way higher than the datastore latency where the VM was sitting. So in the 0.99d release, we decided to add the famous maxTotalLatency:
Highest latency value across all disks used by the host. Latency measures the time taken to process a SCSI command issued by the guest OS to the virtual machine. The kernel latency is the time VMkernel takes to process an IO request. The device latency is the time it takes the hardware to handle the request.
Meet the Multi Cluster Top N VM Latency where you can compare, per cluster, the top N maxTotalLatency metric of your VMs:
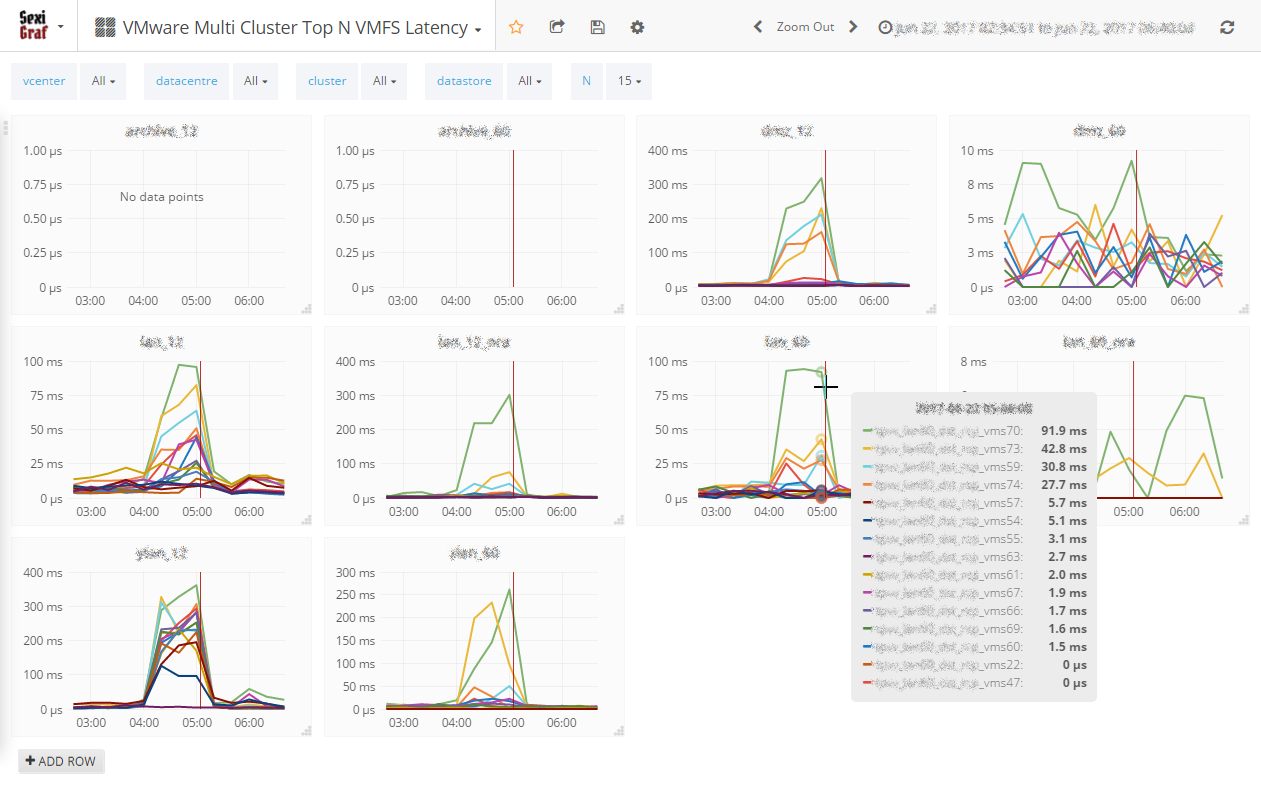
Multi Cluster Top N VMFS Latency
The Cluster IOPS Stats dashboards are great when it comes to compare datastores in the same cluster or average & worst latency between cluster but sometimes it’s useful to be able compare the worst datastores per cluster. Hence the Multi Cluster Top N VMFS Latency dashboard. Don’t let the name fools you, NFS are also in the game (Not vSAN though).
vCenter Active Sessions
Sometimes you may need to monitor vCenter active sessions for troubleshooting purpose since, even if it’s not officially documented (yet), some of us knows the famous “SOAP session count limit reached” error around 2000 active sessions. In SexiGraf 0.99e update, we’ve added a dashboard to let you visualize the active sessions count for every vCenter registered in the credentials store with a user granted with “view and stop sessions” role. Read only accounts won’t work.
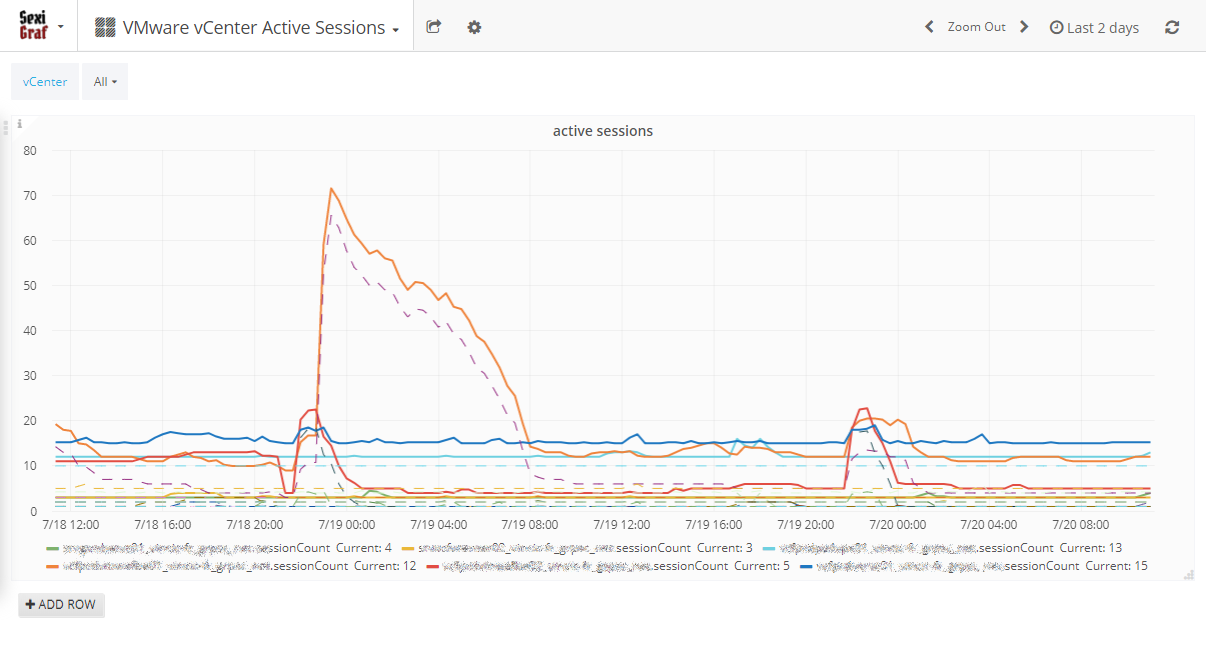
But we didn’t stopped there, we also added a count per username (the dashed lines). it’s SexiGraf after all 😉
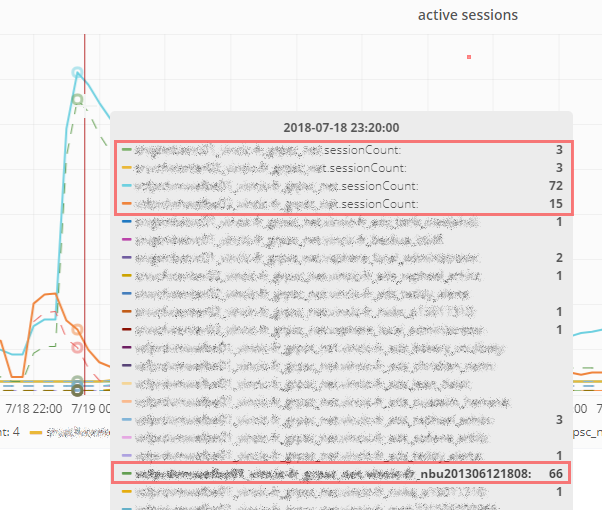
The hover tooltip will show you the vCenter total active sessions on top of the list and all the accounts connected. In the screenshot above we can see that the NetBackup account is the reason of the peak. Backup time obviously 🙂
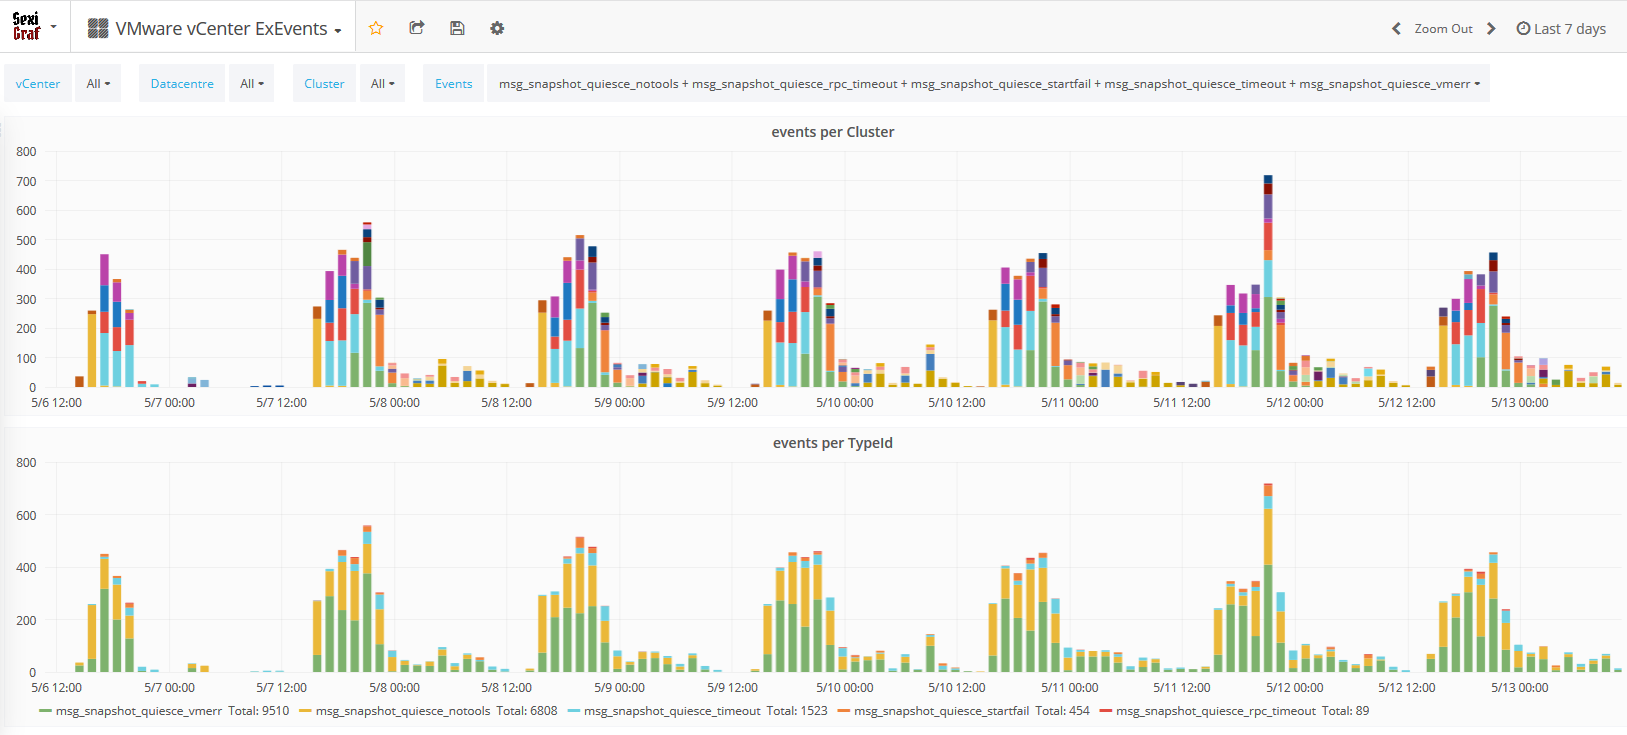
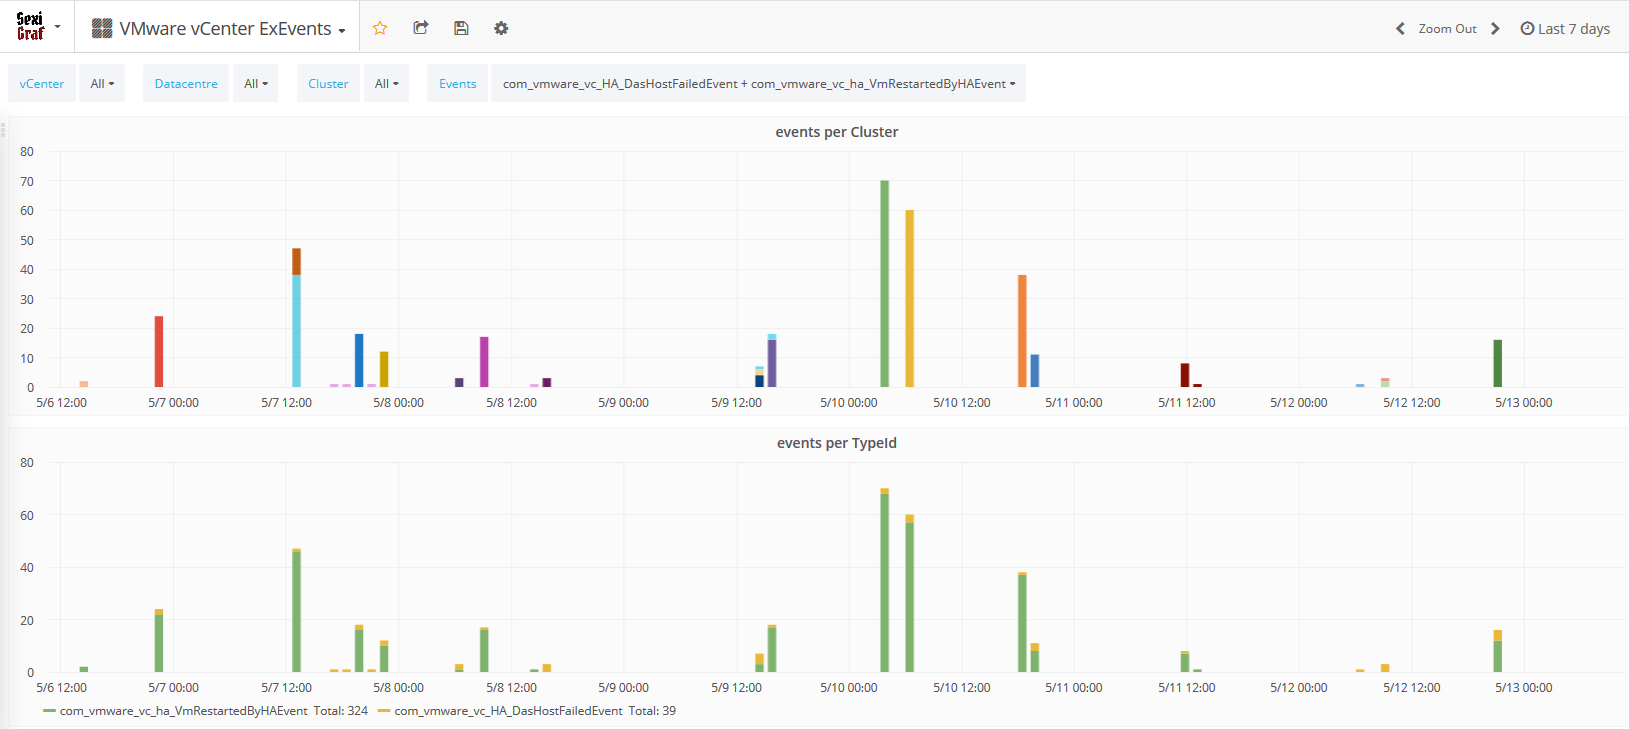
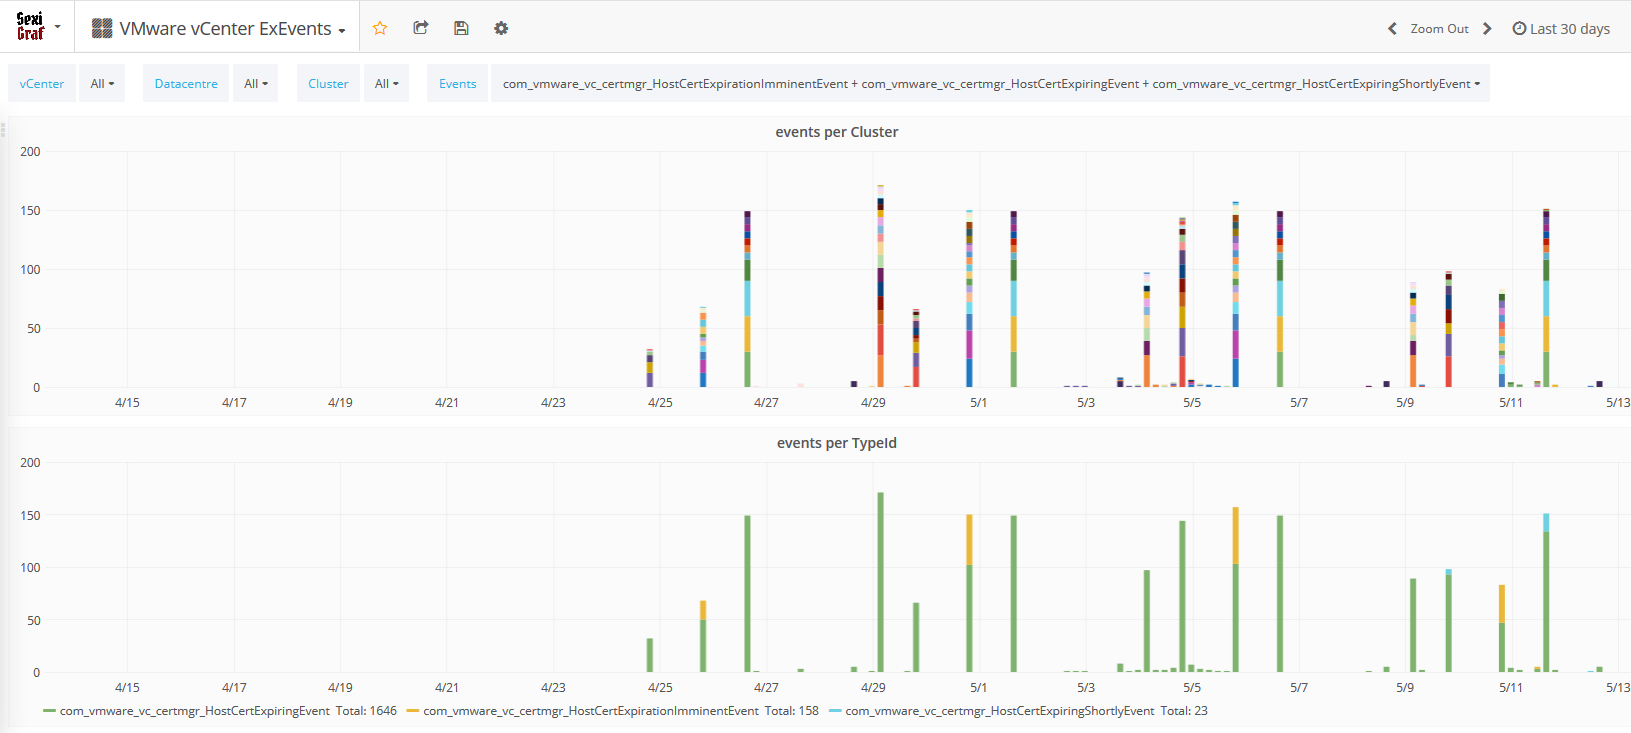
vCenter Bad Events
After years of SexiLog feedback, we figured out that some VMware users are well aware of the ESXi logs monitoring benefits. We also discovered that the configuration needed to get syslog working is sometime confusing (syslog target, firewall, etc..) but also that the security behind it is also a concern. And of course there is the big players with thousands of ESXi to manage. For all those reasons, starting from SexiGraf 0.99f, we now included event monitoring! Bad ones obviously 😉
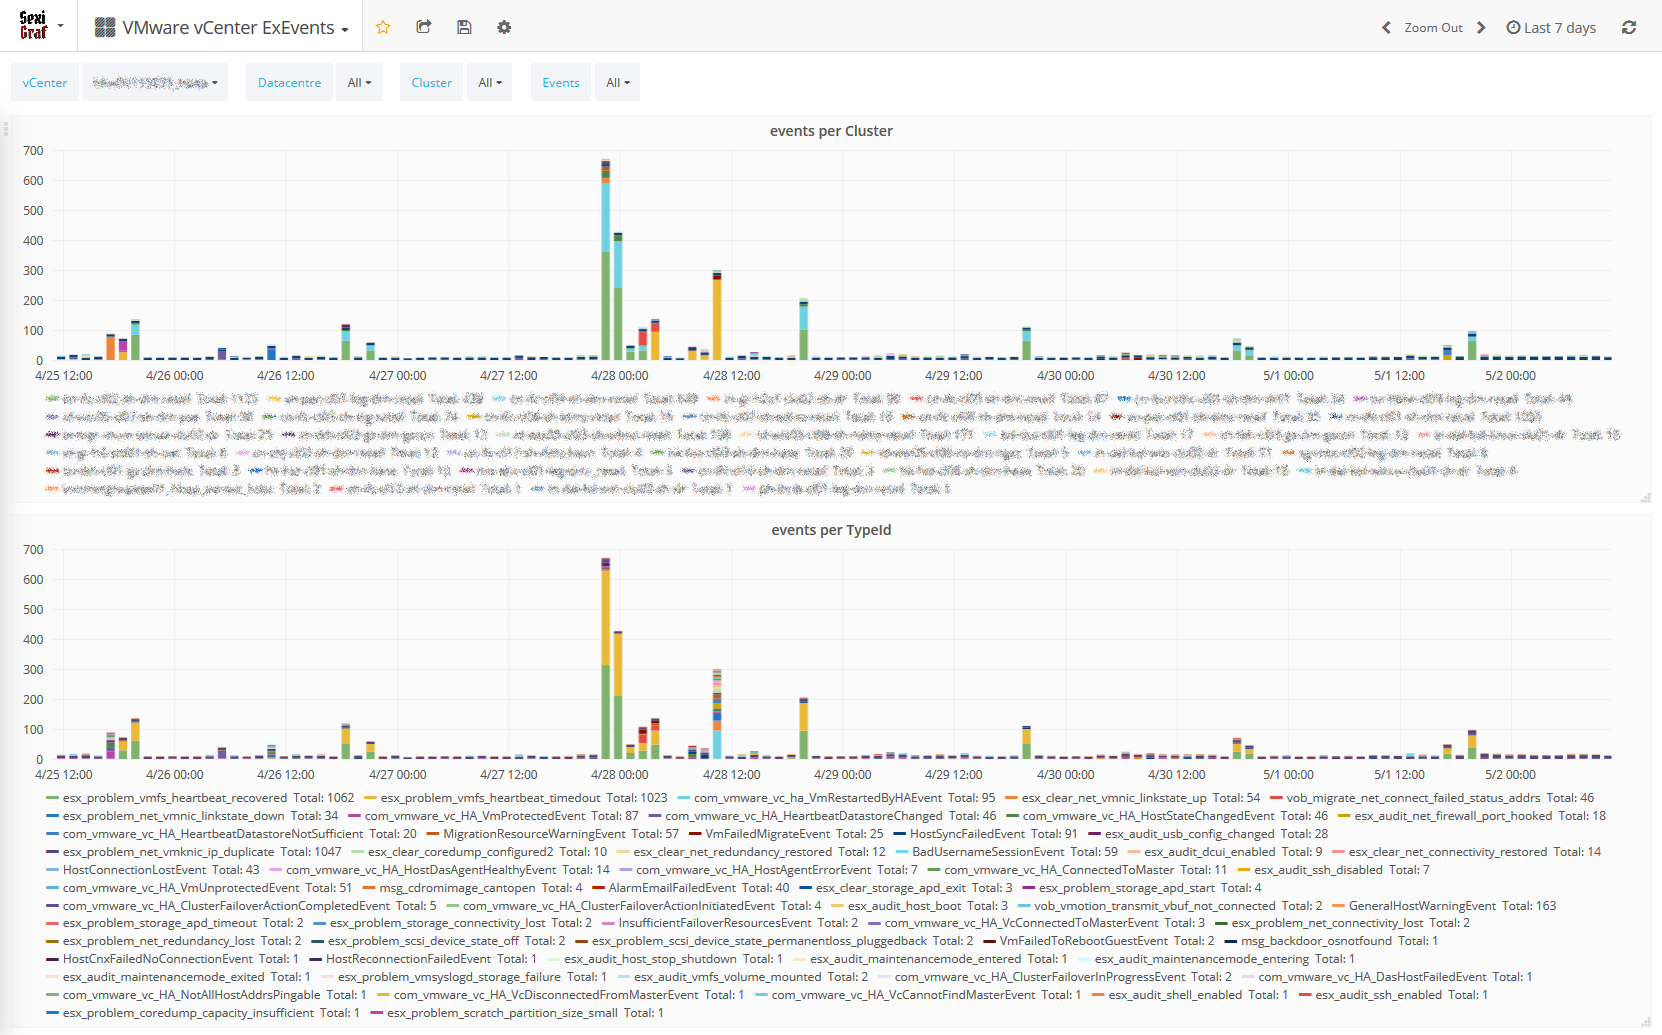
You’ll now be able to see what is happening on your infrastructure (at computeResource level so even standalone hosts are included) without anything more to do but deploy SexiGraf and enjoy our new dashboard with events per Cluster on top and events per TypeId at the bottom. Behind the scene, we fetch the list of “bad” events available on your vCenter so even future vSphere version will be supported and then we ask the eventManager if those events occurred in the last 5 minutes. Here is a small example of what we could get from our “test” setup:
BadUsernameSessionEvent
ClusterOvercommittedEvent
com_vmware_vc_certmgr_HostCertExpirationImminentEvent
com_vmware_vc_HA_DasHostFailedEvent
com_vmware_vc_ha_VmRestartedByHAEvent
com_vmware_vc_VmDiskConsolidationNeeded
esx_audit_host_boot
esx_problem_net_connectivity_lost
esx_problem_net_vmknic_ip_duplicate
esx_problem_scsi_device_state_permanentloss
esx_problem_storage_apd_start
esx_problem_storage_redundancy_lost
esx_problem_visorfs_ramdisk_inodetable_full
esx_problem_vmfs_heartbeat_timedout
esx_problem_vmfs_nfs_server_disconnect
esx_problem_vmfs_resource_corruptondisk
esx_problem_vsan_no_network_connectivity
InsufficientFailoverResourcesEvent
msg_snapshot_quiesce_timeout
VmInstanceUuidConflictEvent
VmMacConflictEvent
VmMaxRestartCountReached
VmOrphanedEvent
vob_fssvec_lookup_file_failed
vob_vmotion_transmit_vbuf_not_connected
This is more than enough for most of any VMware admin but remember, if you want more, you need syslog 😉
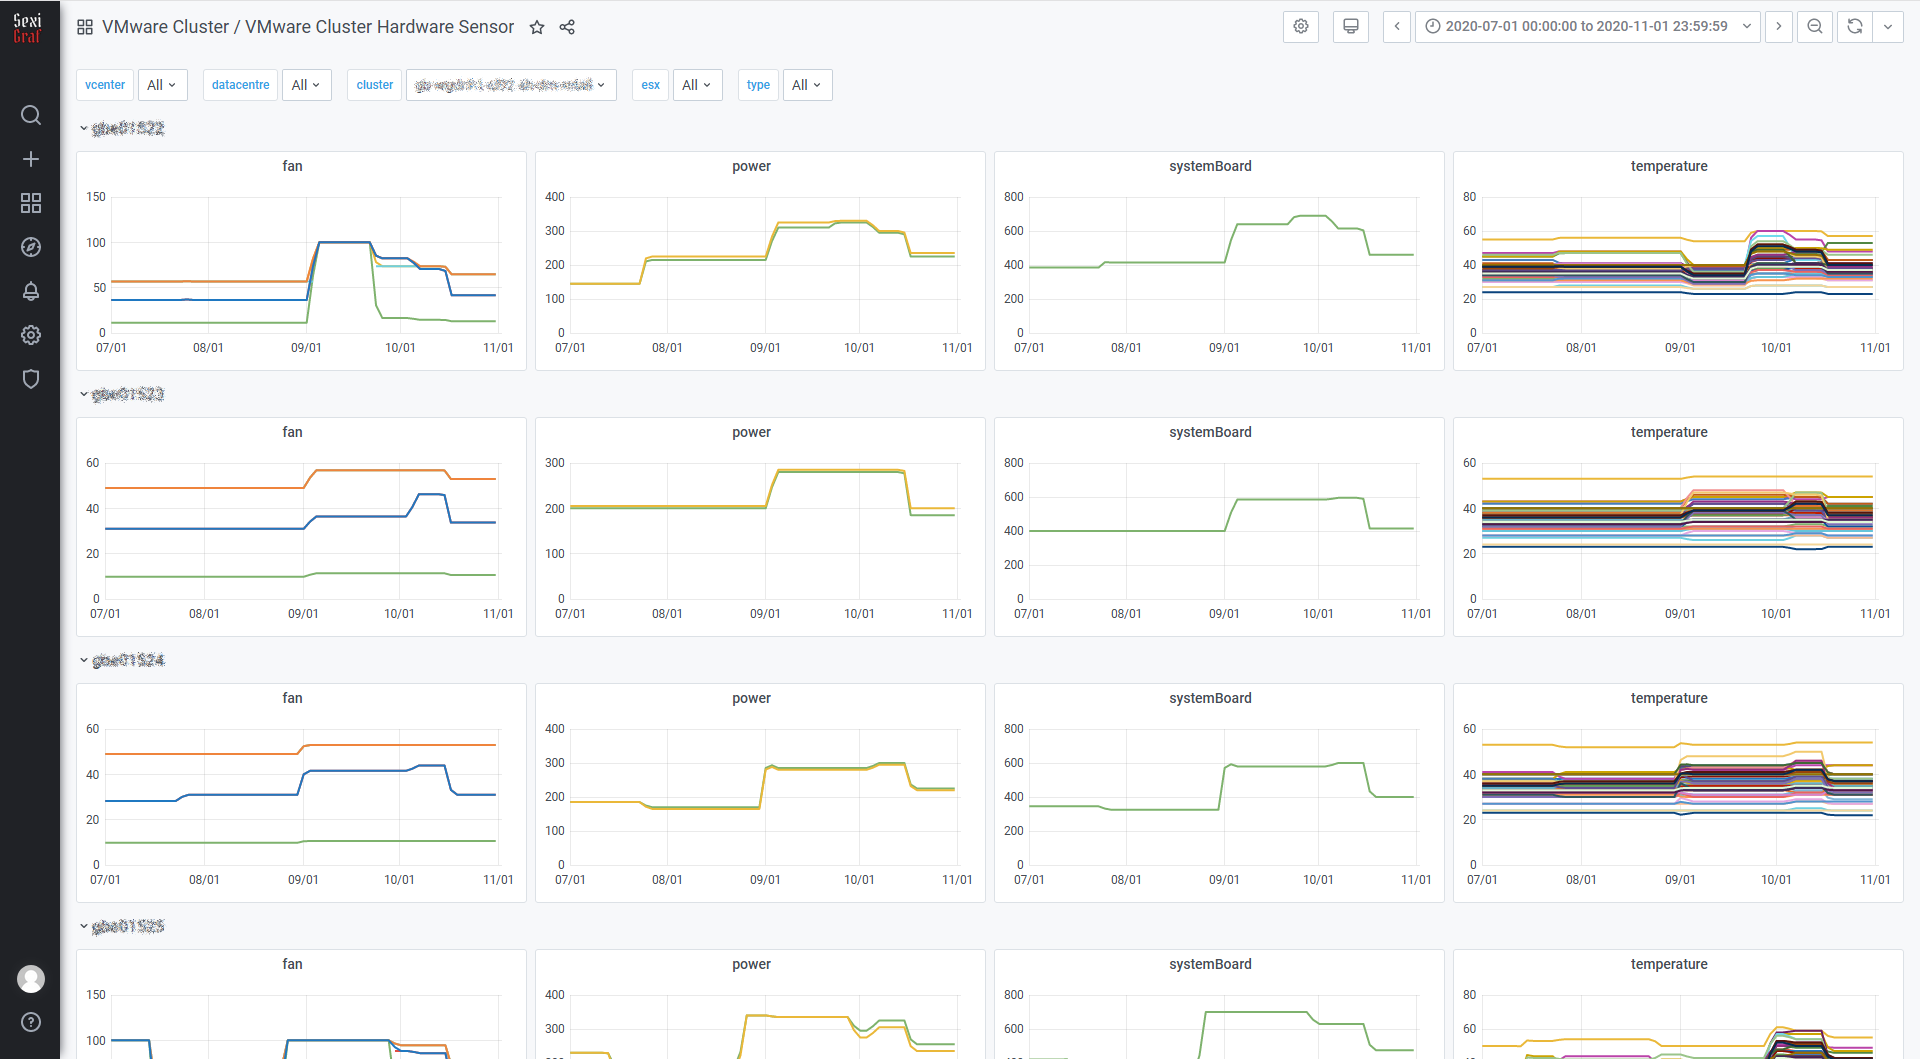
Cluster Hardware Sensor
In SexiGraf 0.99g we’re introducing another unique cool dashboard focused on IPMI hardware sensors. The hardware health tab (formerly hardware status) let you know the CURRENT values of various hardware sensors not the evolution of those metrics.
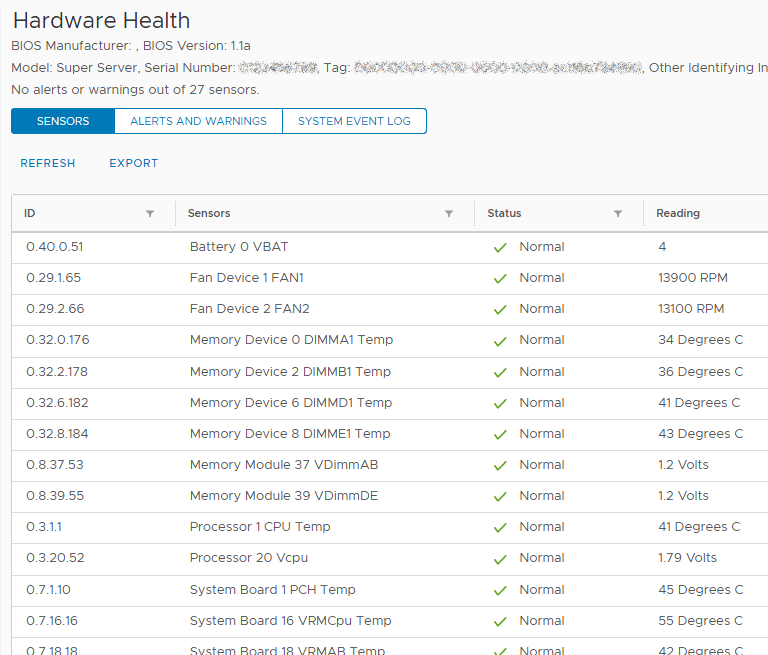
Now you got the history as well:
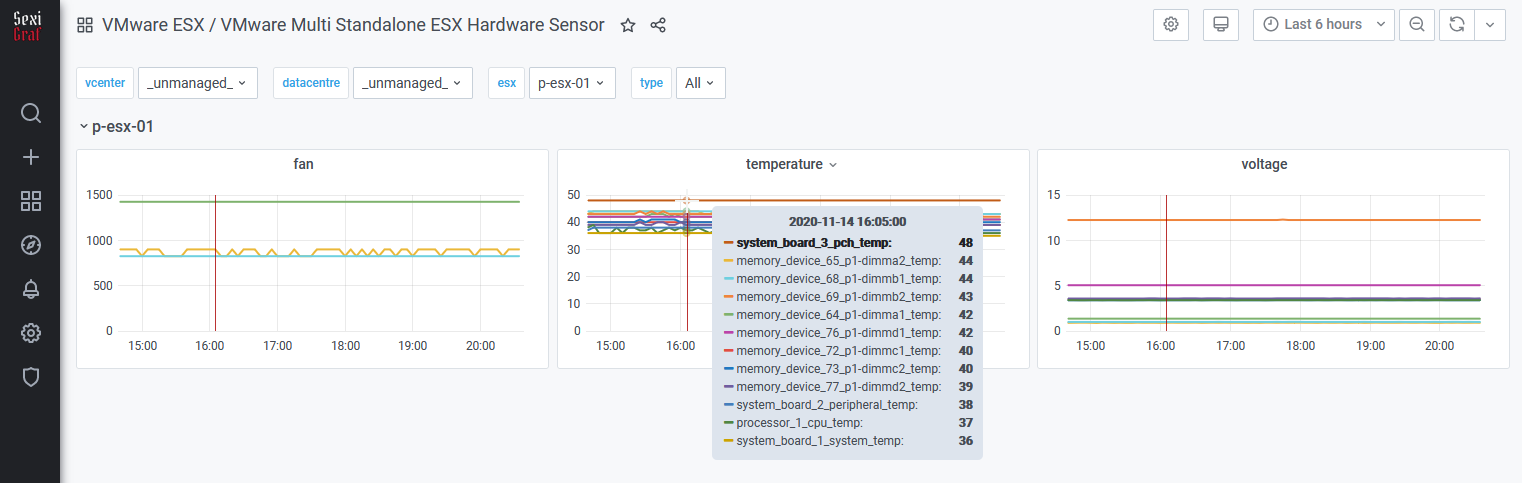
Of course we made a dashboard for standalone/unmanaged ESX too 😉
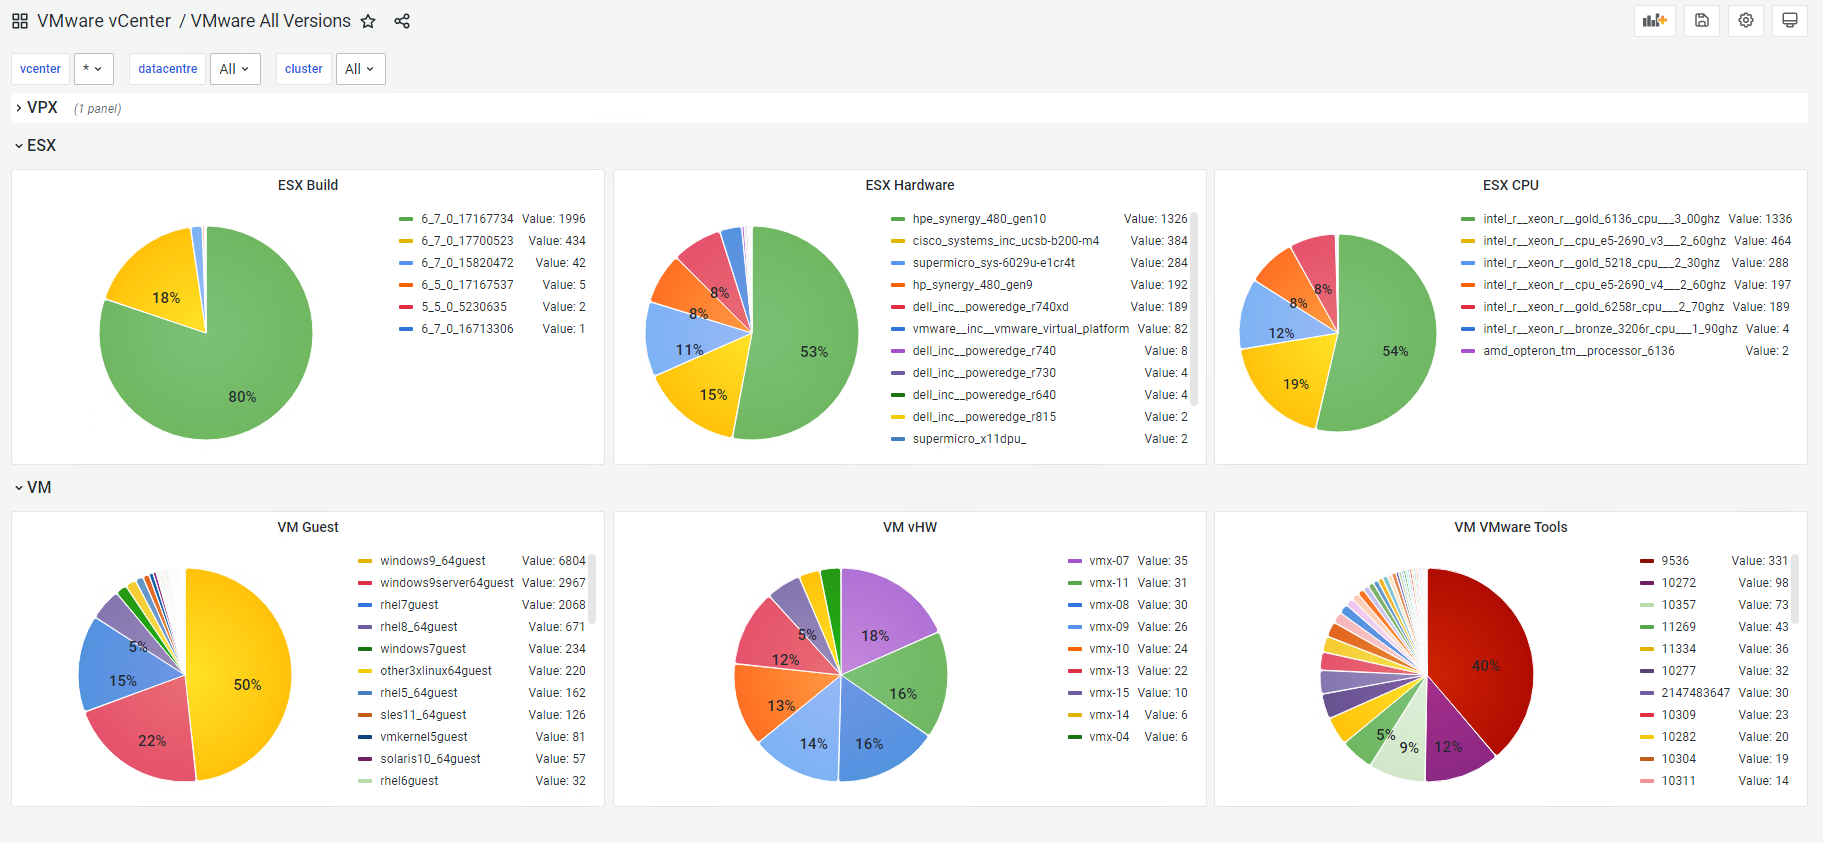
VMware All Version
In SexiGraf 0.99h we’re introducing another unique cool dashboard focused on versioning. You can now quickly look at the “version” of various items like ESX build, VMtools or even CPUs grouped in the new grafana pie chart. We’ll add more items in the future of course.
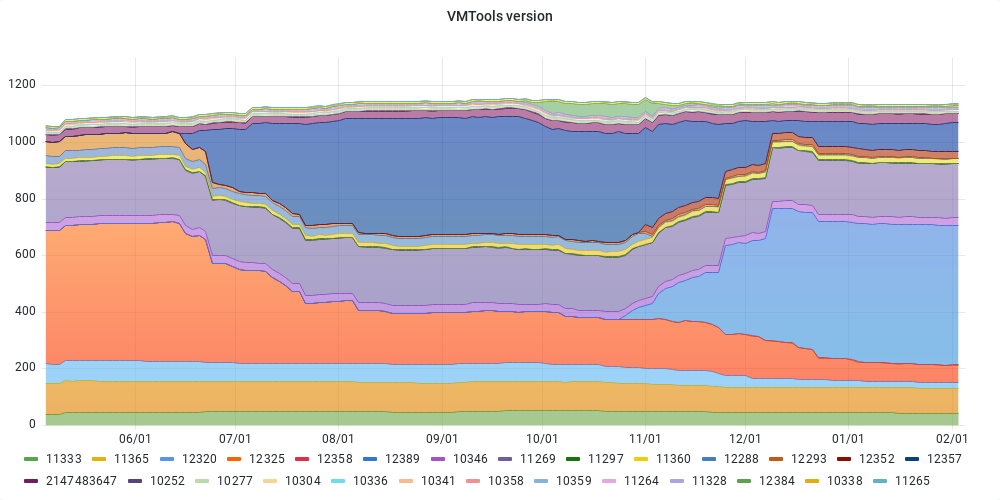
VMware Evo Version
Leveraging the data from the All Version dashboard, we’ve introduced the Evo Dashboard in SexiGraf 0.99j where you can visualize the versions evolution over a time period. So far we’ve included VMTools, GuestId, vHardware and ESX versions.