Here is how you can get and quickly setup this awesome appliance named SexiGraf.
Step 1: Get SexiGraf
Download OVA appliance – v0.99l “Overwatch Nexus”
72b32edada5cb07e579fa28407604b41ffcf8bc4 sexigraf.ovaSex!Gr@fStep 2: Deploy
SexiGraf appliance aimed to be deployed on a VMware vSphere™ environment which can be achieve via several ways:
- vSphere client (http://pubs.vmware.com/vsphere-50/topic/com.vmware.vsphere.vm_admin.doc_50/GUID-6C847F77-8CB2-4187-BD7F-E7D3D5BD897B.html)
- vSphere Web Client (http://pubs.vmware.com/vsphere-55/topic/com.vmware.vsphere.vm_admin.doc/GUID-AFEDC48B-C96F-4088-9C1F-4F0A30E965DE.html)
- VMware OVF Tool command-line utility (https://www.vmware.com/support/developer/ovf/)
- vSphere HMTL5 Client (https://docs.vmware.com/en/VMware-vSphere/6.5/com.vmware.vsphere.vm_admin.doc/GUID-17BEDA21-43F6-41F4-8FB2-E01D275FE9B4.html)
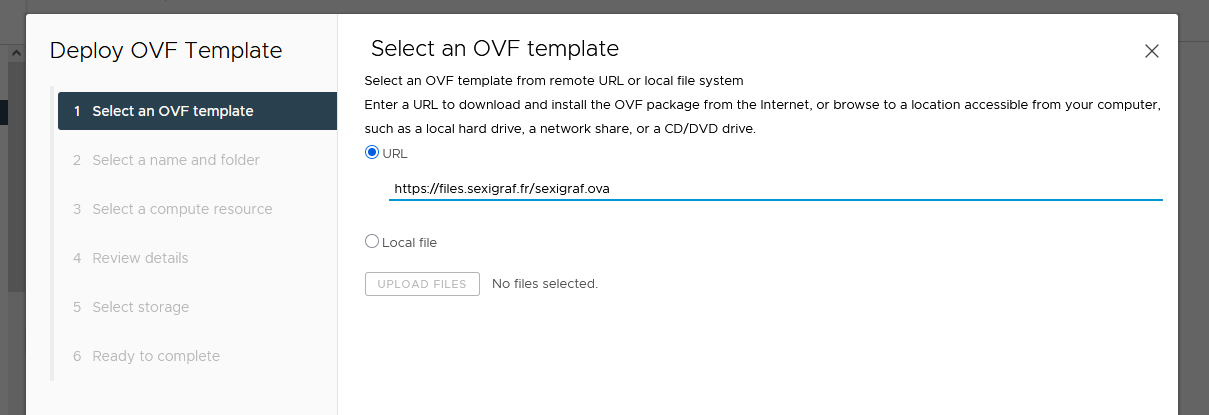
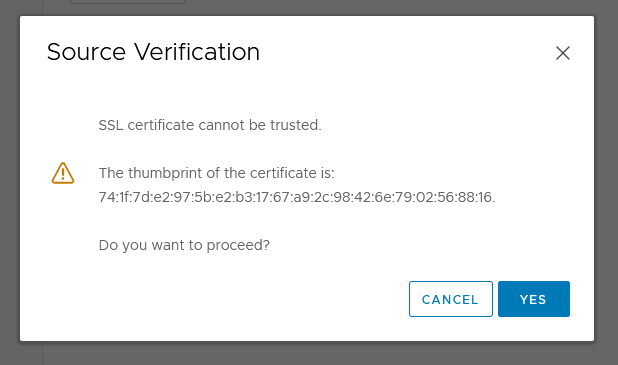
You can also add the ova url in the ovf deployement wizard (don’t mind the SSL warning):
Step 3: Configure
Starting from version 0.99c you can configure network settings during the deployment step and change them later thanks to OVF properties:
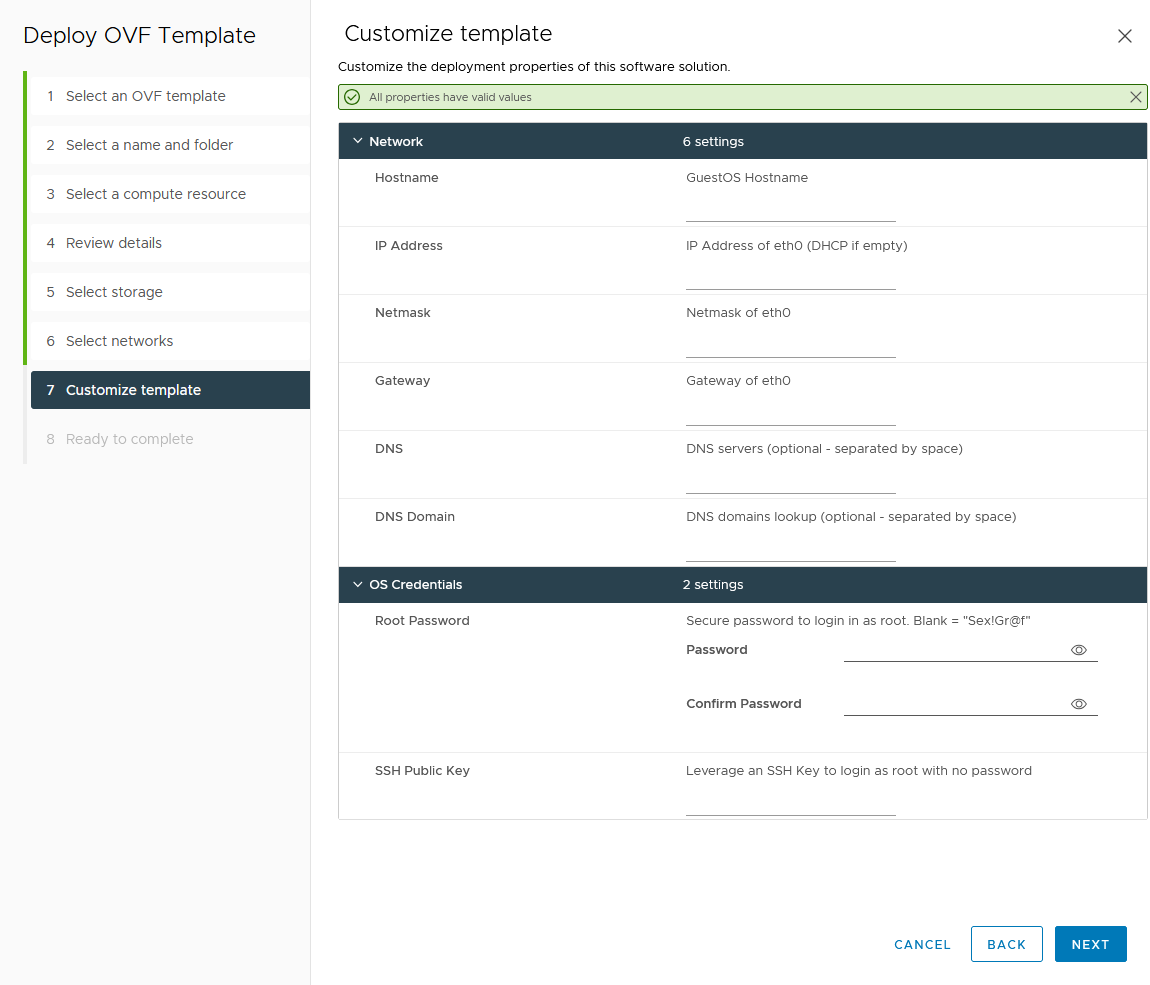
By default, SexiGraf is pre-configured in DHCP mode. If you specify network infromations, the appliance will switch into static mode. Since version 0.99l you can also override the default root password and an SSH key.
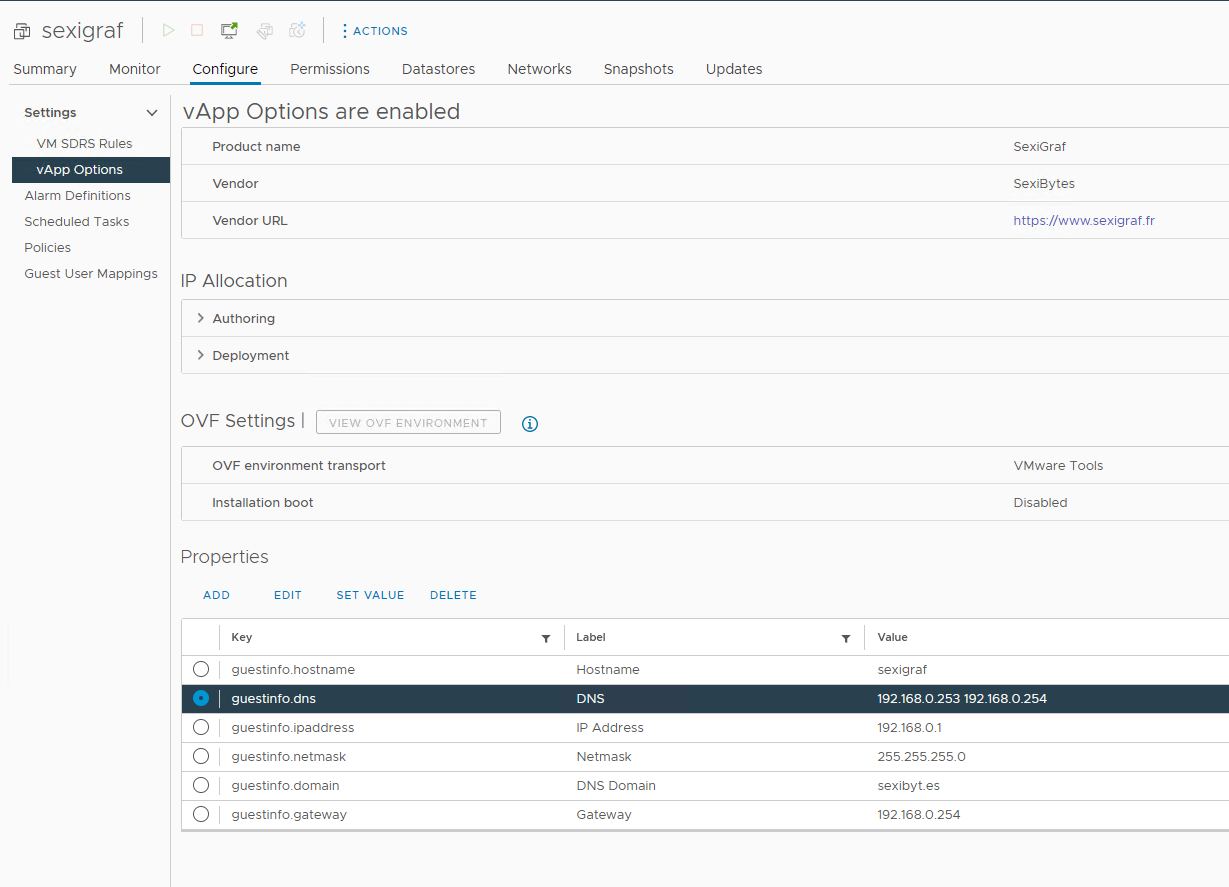
If you need to make changes later, you need to shutdown the VM to be able to edit the vApp Options within vCenter:
Step 4: Add your vCenter/ESXi informations
In order for SexiGraf to retrieve informations and performance counters from your vCenter and ESXi servers, you must add your vCenter/ESXi info and some credential. You can do that very easily as we made some fancy SexiPanel just for you!
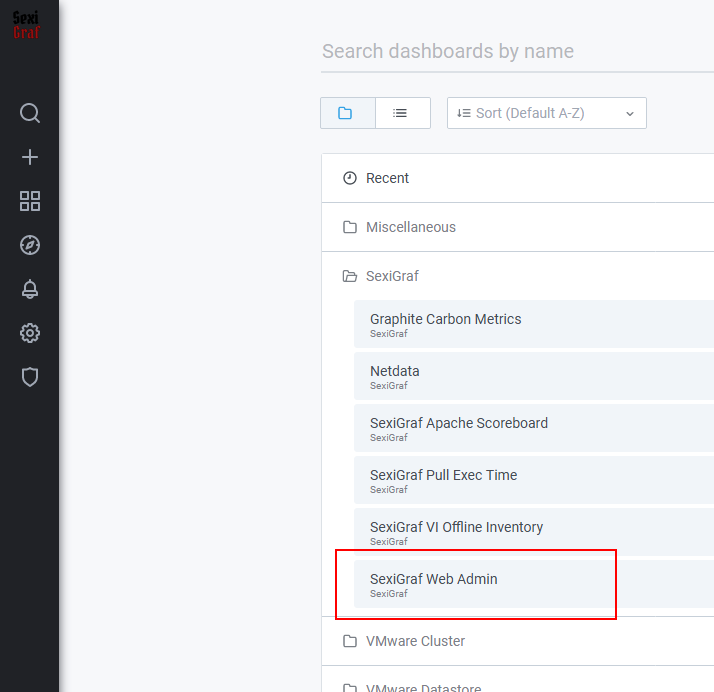
First of all, connect to your SexiGraf web interface (ie Grafana), which is listening on TCP port 80 so you can reach it at http://your_appliance_fqdn_or_ipv4/ and select the following dashboard: SexiGraf Web Admin. Starting from version 0.99e you can reach your SexiGraf appliance on TCP port 443 as well at https://your_appliance_fqdn_or_ipv4/ thanks to a self-signed that you can change by replacing /etc/apache2/ssl/sexigraf.key and /etc/apache2/ssl/sexigraf.crt via SSH. Starting from version 0.99i http is redirected to https for security issues.
admin / Sex!Gr@f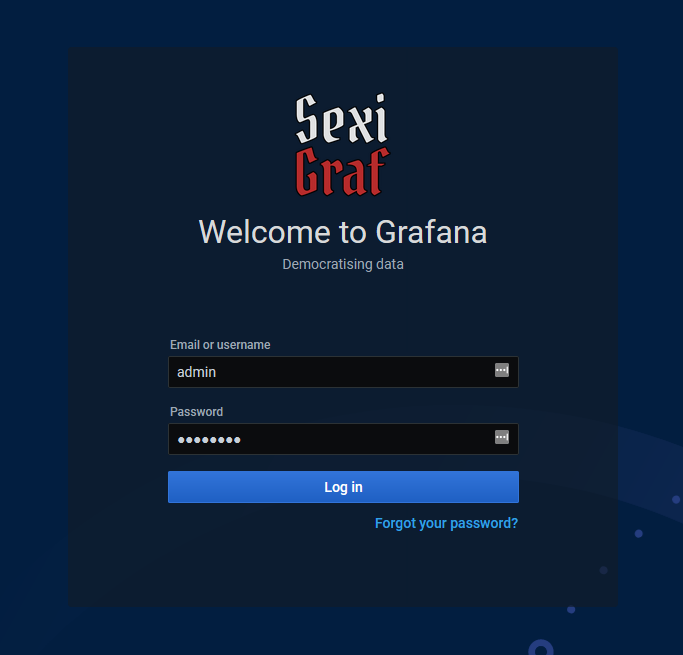
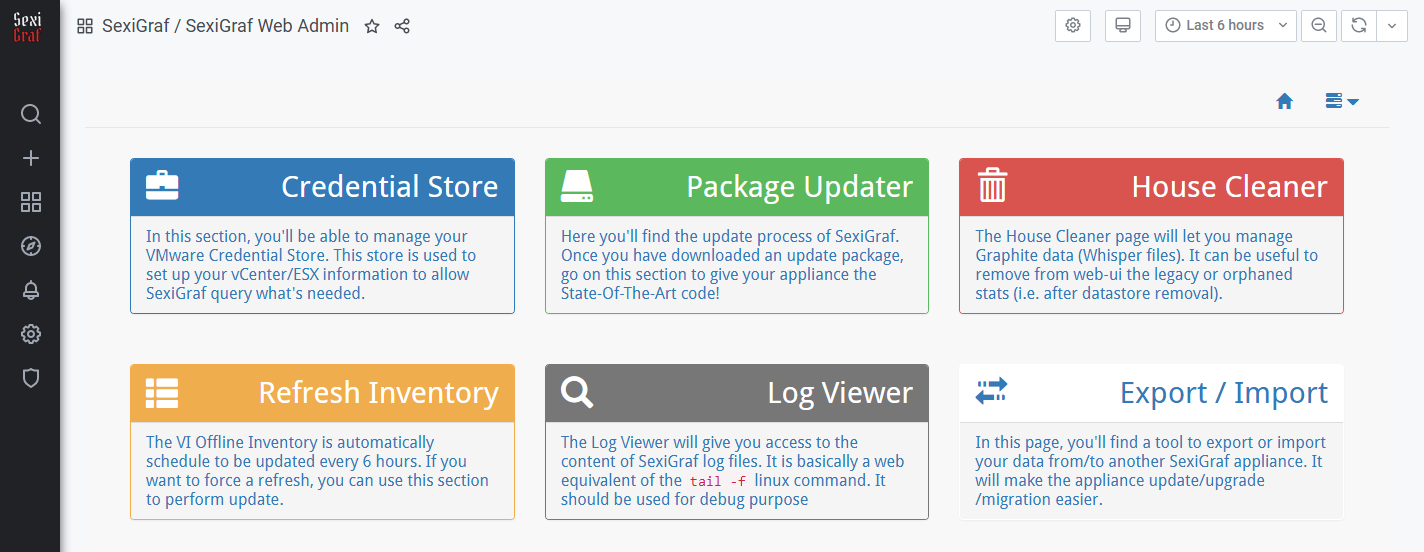
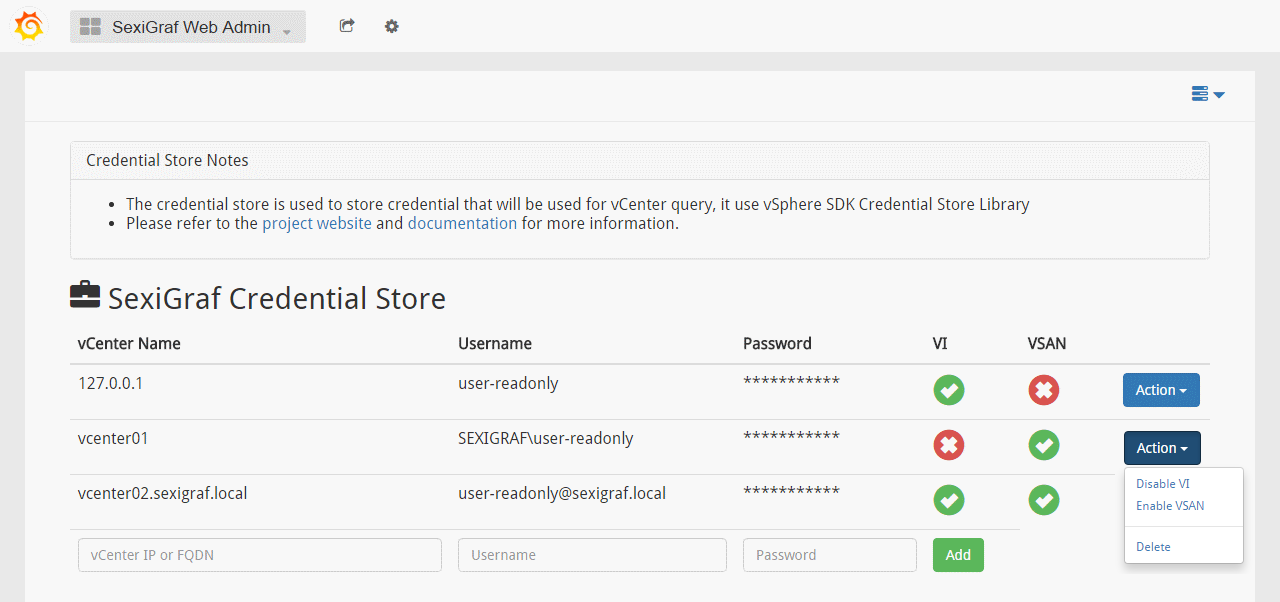
Then you’ll just have to click on Credential Store and enter your vCenter/ESXi information (FQDN or IP, username and password). Once you’ve added a vCenter/ESXi, click on the Action dropdown and select Enable VI and Enable VSAN (if you got any VSAN cluster):
Starting from version 0.99g unmanaged ESXi (aka not connected to any vCenter) are supported. The dashboards are the same as the standalone hosts but under “_unmanaged_” vcenter and datacentre.