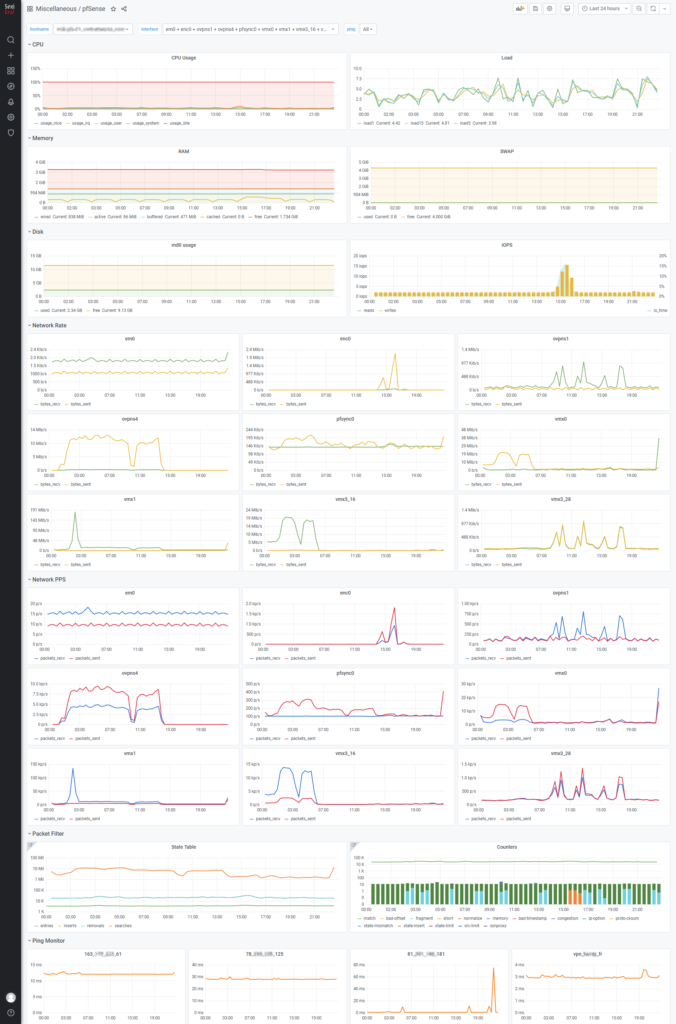
Because we love and use pfSense very much since the m0n0wall fork, we decided to make a great dashboard with system metrics, interface statistics but most importantly the pfinfo data which let you monitor the packet filtering service of the firewall.
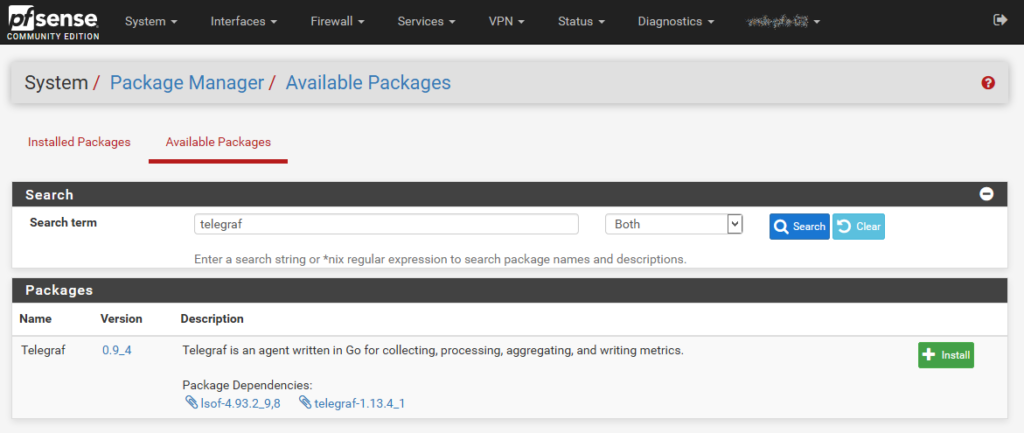
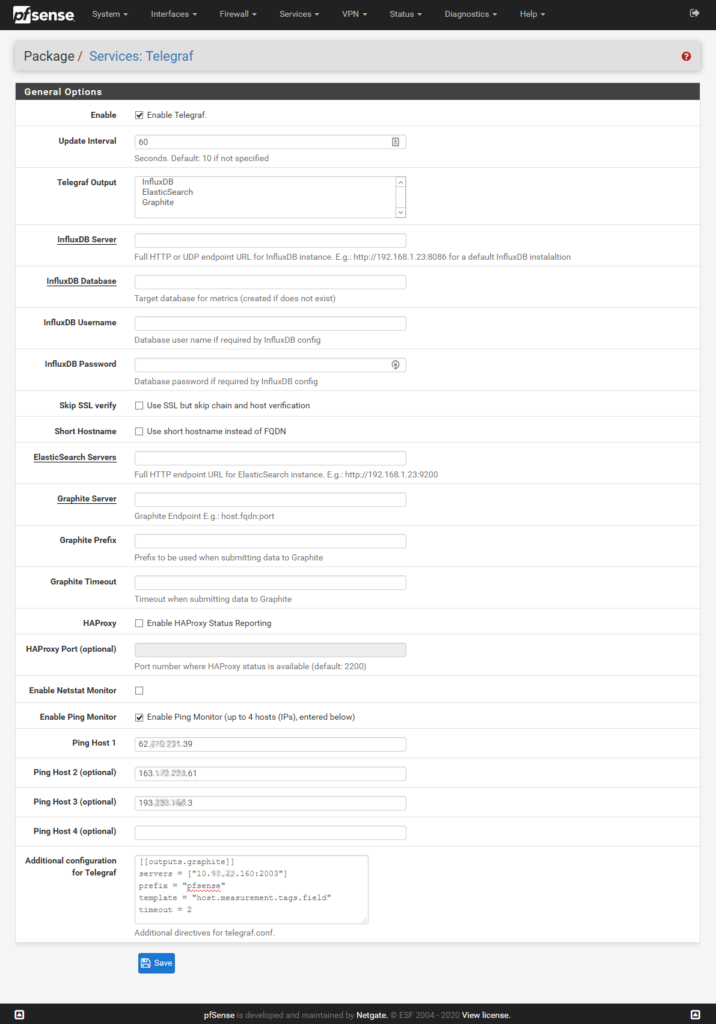
All you need to do is to install the pfSense Telegraf package and configure it EXACTLY as follow (except for 192.168.0.1 where you’ll have to specify your own SexiGraf IP address):
[[outputs.graphite]]servers = ["192.168.0.1:2003"]prefix = "pfsense"template = "host.measurement.tags.field"timeout = 2
You can even monitor up to 4 FQDN/IP as a bonus.


