vSAN Monitor vSAN Monitor 2nd FTT vSAN Capacity SSD Stats Top N vmdk Resync NAA Latency Diskgroup Capacity Space Usage Report Disk Utilization
The metrics used in the various vSAN dashboards are collected every minutes using to the QueryVsanStatistics API method of HostVsanInternalSystem. With some json ticks, it is possible to access any metrics from the vSAN cluster. And guess what! We’re already working on other cool SexiPanels for VSAN…
vSAN Monitor
If this dashboard looks familiar this is because it is heavily inspired from vSAN Observer:
But unlike vSAN Observer, SexiGraf makes vSAN Monitor persistent because when you need it you most likely want to know what just happened. Since you have to launch vSAN Observer and wait few minutes, that particular moment is gone. vSAN Monitor let you explore 6 months from now so you can relax.
Nevertheless, vSAN Monitor is NOT a replacement for vSAN Observer since it only offers the primary “tabs” where you’ll be able to check the global activity of your vSAN cluster per nodes. When you need to deep dive, you’ll still need vSAN Observer. Badly.
Since some brillant guys at VMware already explain how to read vSAN metrics, you’ll need to check those papers if you not already did : Monitoring VMware Virtual SAN with Virtual SAN Observer & VMware Virtual SAN Diagnostics and Troubleshooting Reference Manual.
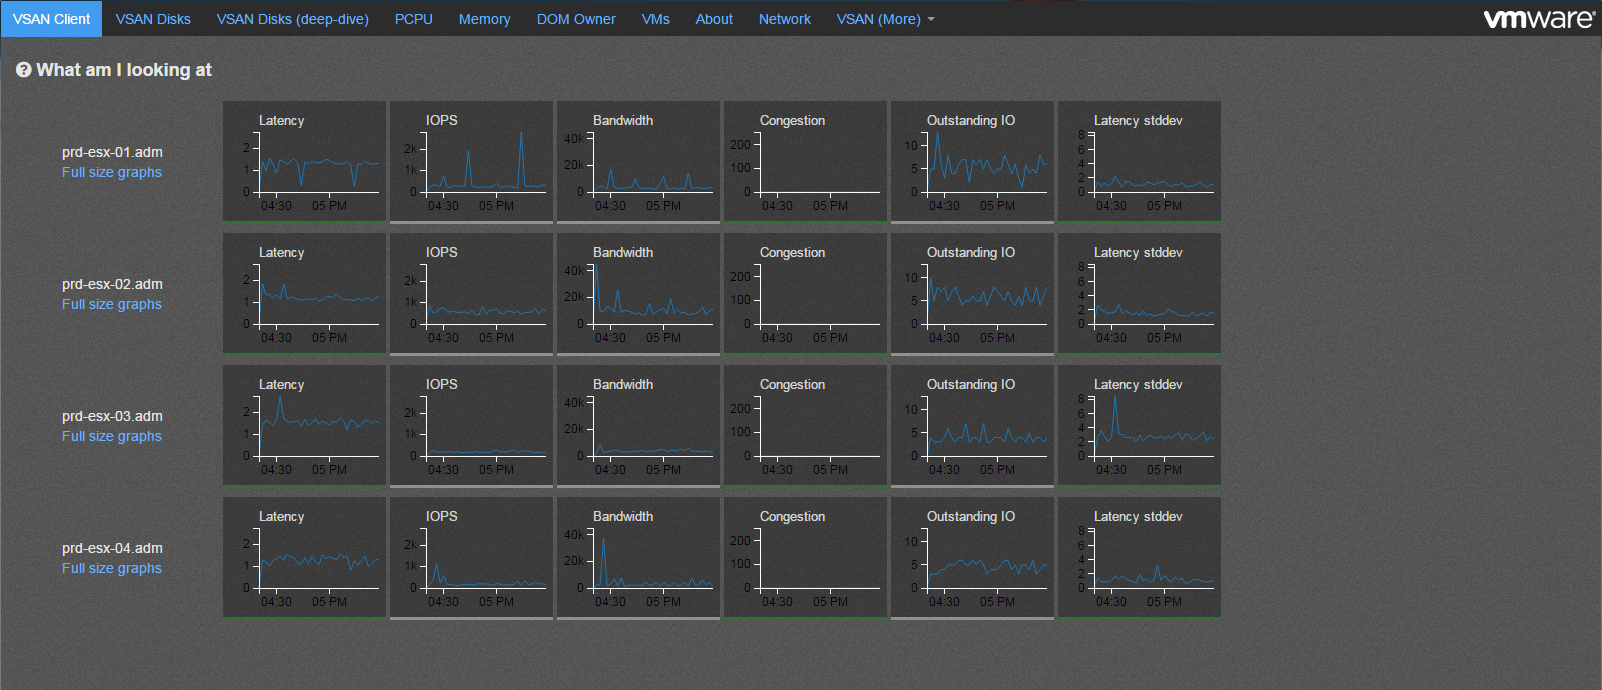
The layer label let you switch beetween vSAN layers described in the vSAN Observer help section:
Client: This view shows vSAN statistics from the view point of the vSAN client running on each host. In other words, this view represents the vSAN performance as seen by VMs running on the hosts for which statistics are shown.
If this view shows any unexpected performance, one needs to drill down further to understand where performance issues may be coming from. It is important to understand that due to the distributed nature of vSAN each host accesses data from all hosts, so any performance issue seen on this view may be caused by any host in the vSAN cluster.
Disks: This view shows vSAN statistics of the physical disk layer of each host. In other words, this view allows to determine if there is any contention on any of the disk groups that make up the overall vSAN cluster. Note that the statistics shown are purely the physical disk layer and do not include any other vSAN overhead (e.g. networking or vSAN RAID). Also remember that due to the distributed nature of vSAN the physical disks of one host are accessed by VMs on all hosts in the vSAN cluster.
If this view shows physical disk contention across a majority of hosts then this likely indicates that the workload run by VMs is collectively higher than the vSAN cluster can handle. In that case, either reduce the storage workload, or check the detailed physical device view to determine if you need more HDDs or SSDs.If however only a single host’s physical disks are contended, while other hosts are operating fine, then you may have an imbalance, e.g. caused by particularly noisy VMs.
Owner: The DOM owner is a vSAN internal layer. For every vSAN object vSAN elects one host to be the ‘owner’. The owner performance all RAID functionality and ensures correctness, even under concurrent access by multiple clients. All IO flows from the vSAN client to the owner and then to the disk layer. vSAN tries to co-locate the owner and the client to not incur an additional network hop. However, the user can’t influence where the owner for a given object is located, so reading the below graphs and correlating them with the client and disks graphs can be very difficult.
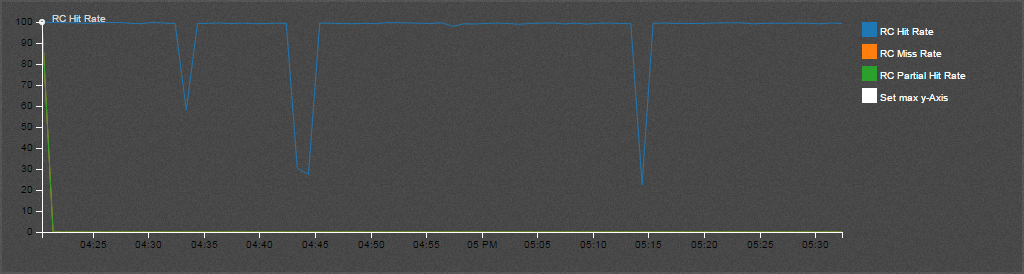
You may have noticed the last column is not Latency stddev but Read Cache Hit Rate since we believe it offers a more syntetic view. We also got thresholds like vSAN Observer but Grafana’s are areas so you know exaclty when the metric hits the roof and for how long. As per vSAN Observer settings, the threshold for latency is 30ms, 20 for congestion and 30 for latency SD.
We also added colors 😉
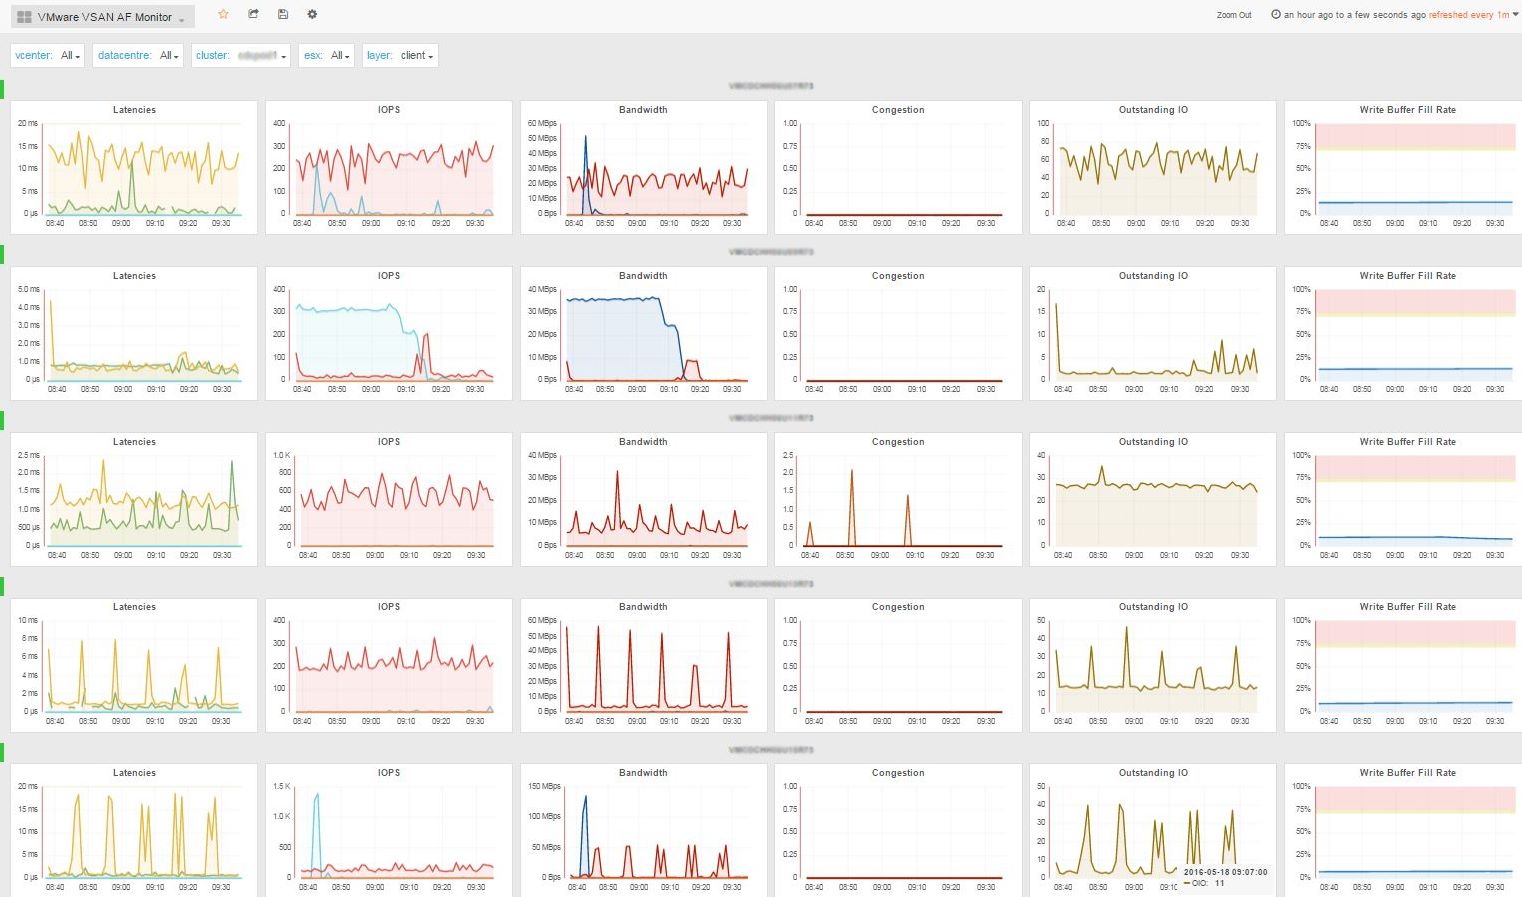
Since All Flash cluster has no SSD read cache, we added a dedicated AF version of the vSAN monitor dashboard in v0.99c
All-flash clusters have two types of flash: very fast and durable write cache, and more capacious and cost-effective capacity flash. Here cache is 100% allocated for writes, as read performance from capacity flash is more than sufficient.
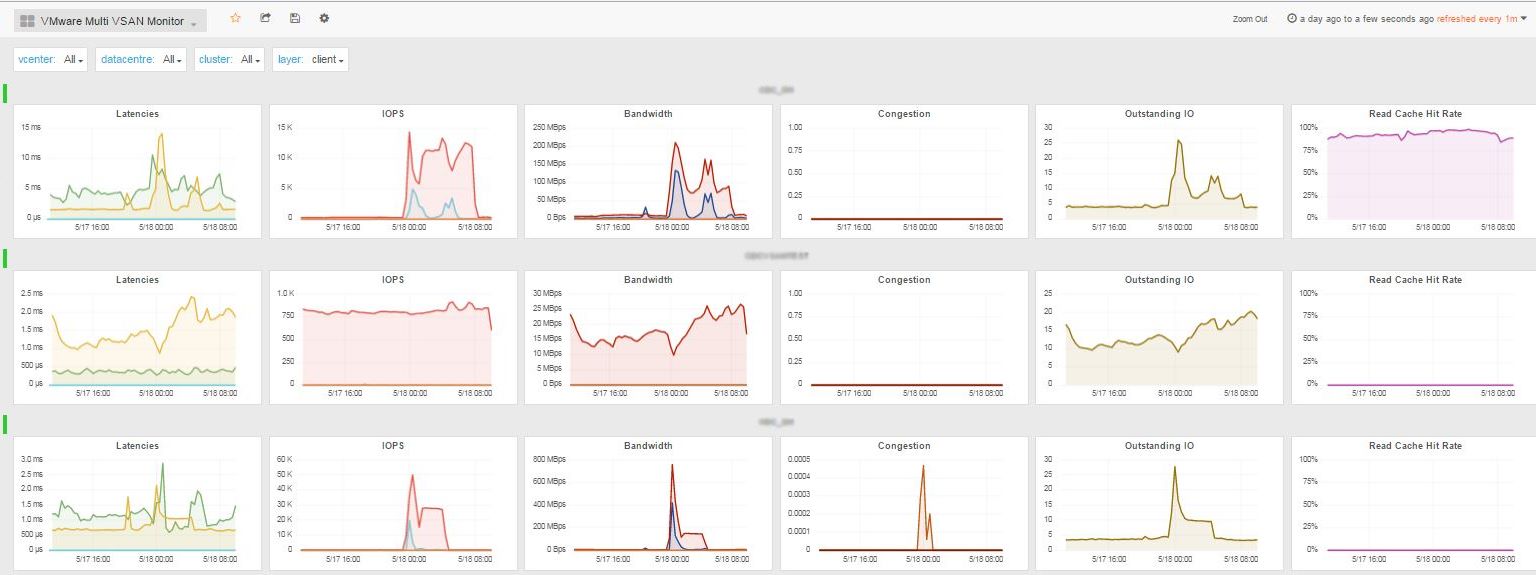
Some of you also asked us a dashboard to let them monitor multiple vSAN clusters at once. Enjoy the new VMware Multi vSAN Monitor dashboard (from v0.99c):
Support for vSAN 6.6 APIs has been added to SexiGraf 0.99d so for those having ESXi 6.5.0d+ vSAN cluster with v5 on-disk format, we’ve created an enhanced vSAN Monitor 66 dashboard with the new resyncRead and client.cachestats metrics.
The new client cache was introduced in vSAN 6.2 but not exposed in the public APIs until vSAN 6.6 release.
As of 6.2 vSAN also has a small in-memory read cache. Small in this case means 0.4% of a host’s memory capacity up to a max of 1GB. Note that this in-memory cache is a client side cache, meaning that the blocks of a VM are cached on the host where the VM is located.
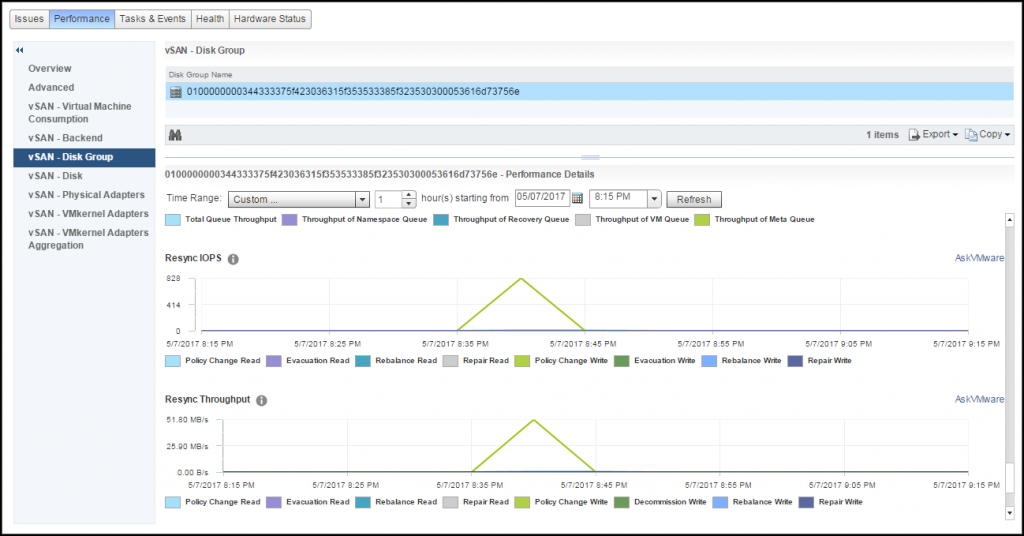
Since vSAN 6.6, you can also monitor the resync traffic per diskgroup from within the vCenter UI!! \o/
vSAN Monitor 2nd FTT
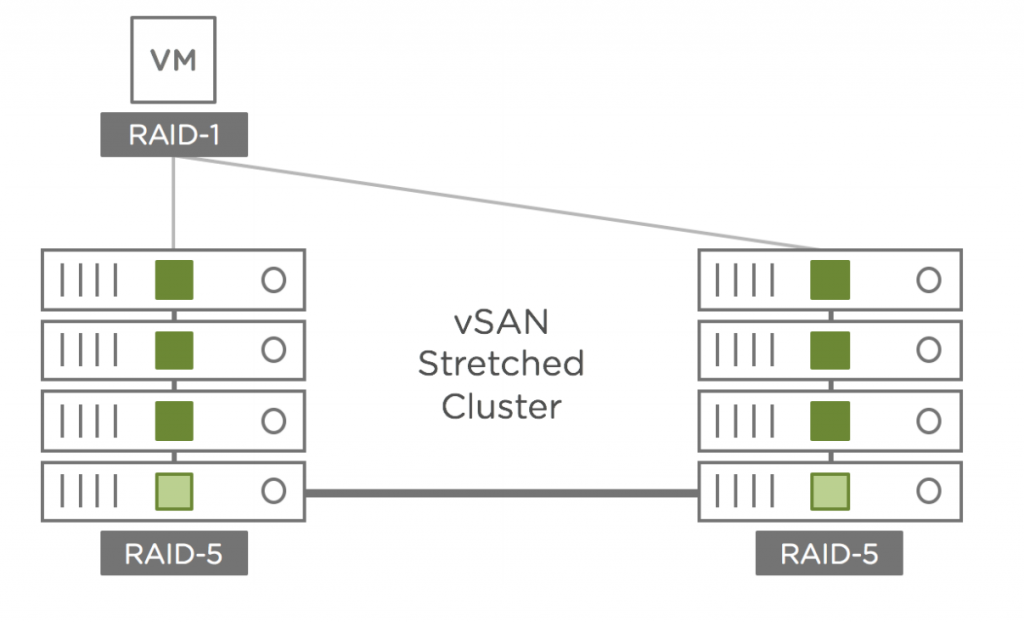
As described in VMware vSAN 6.6 Technical Overview white paper, vSAN 6.6 introduce secondary level of failures to tolerate (SFTT) for stretched clusters:
Starting with vSAN 6.6, it is possible to configure a secondary level of failures to tolerate. This feature enables resiliency within a site, as well as, across sites. For example, RAID-5 erasure coding protects objects within the same site while RAID-1 mirroring protects these same objects across sites.
After snooping into the undocumented metrics, we discovered that the SFTT traffic is “monitorable” through 2 new counters called “proxy” and “anchor” so, starting from v0.99d, we added a dedicated dashboard inspired from the vSAN Monitor one. Meet vSAN Monitor 2nd FTT:
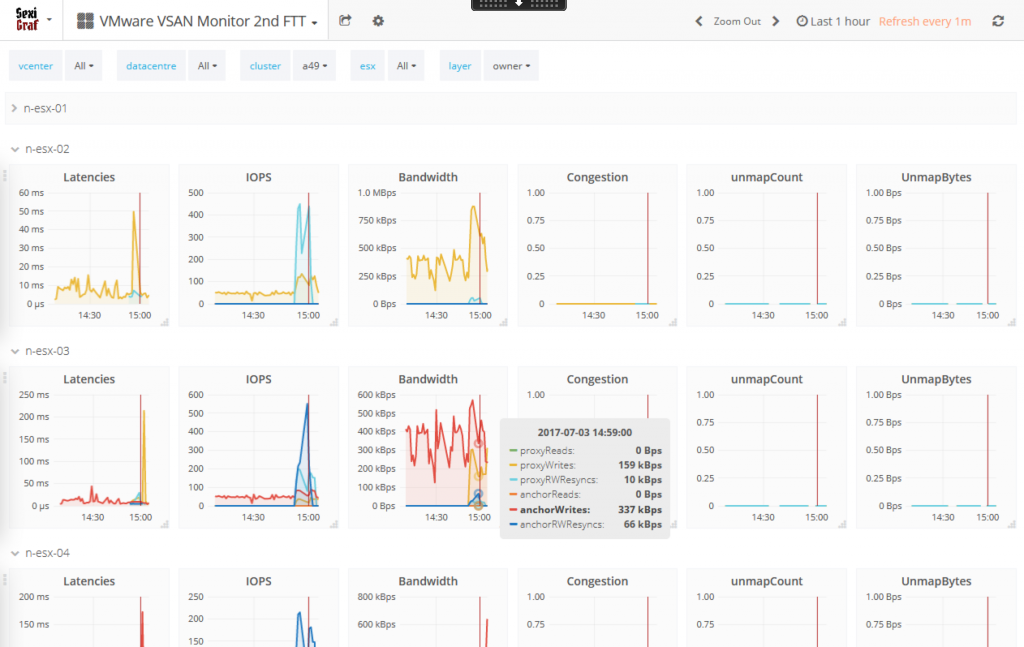
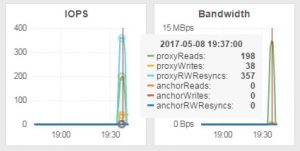
Since we had some free space left on the dashboard, we also added some UNMAP metrics.
vSAN Capacity
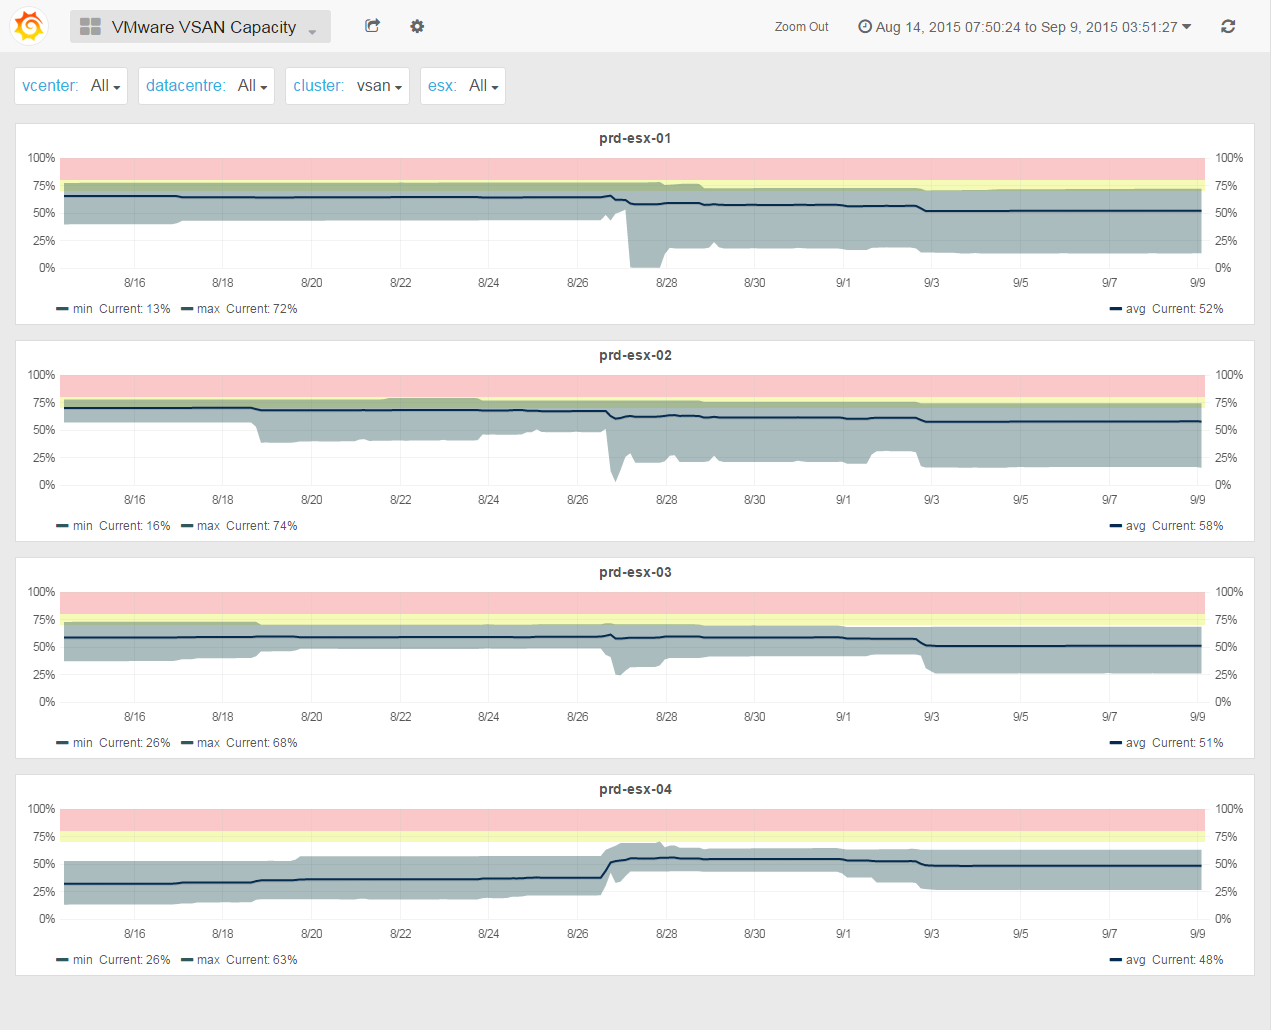
As per VMware Virtual SAN 6.0 Design and Sizing Guide: “VMware is recommending, if possible, 30% free capacity across the Virtual SAN datastore. The reasoning for this slack space size is that Virtual SAN begins automatic rebalancing when a disk reaches the 80% full threshold, generating rebuild traffic on the cluster”. Moreover, if one disk (or flash capacity) of a disk group is full, the VM with objects on it are stunned until vSAN has finish the rebalance of the objects.
In vSAN Observer, you can check the upper, lower and average disk (or flash capacity) usage per host but not per cluster and most importantly you won’t be able to see the trend so you won’t be able to predict anything.
The vSAN Capacity dashboard shows you the nodes capacity metrics of the entire cluster and allow you to anticipate futur storage needs. For each host, the shadow represents the min/max area of the diskgroups and the dark line represents the average.
vSAN SSD Stats
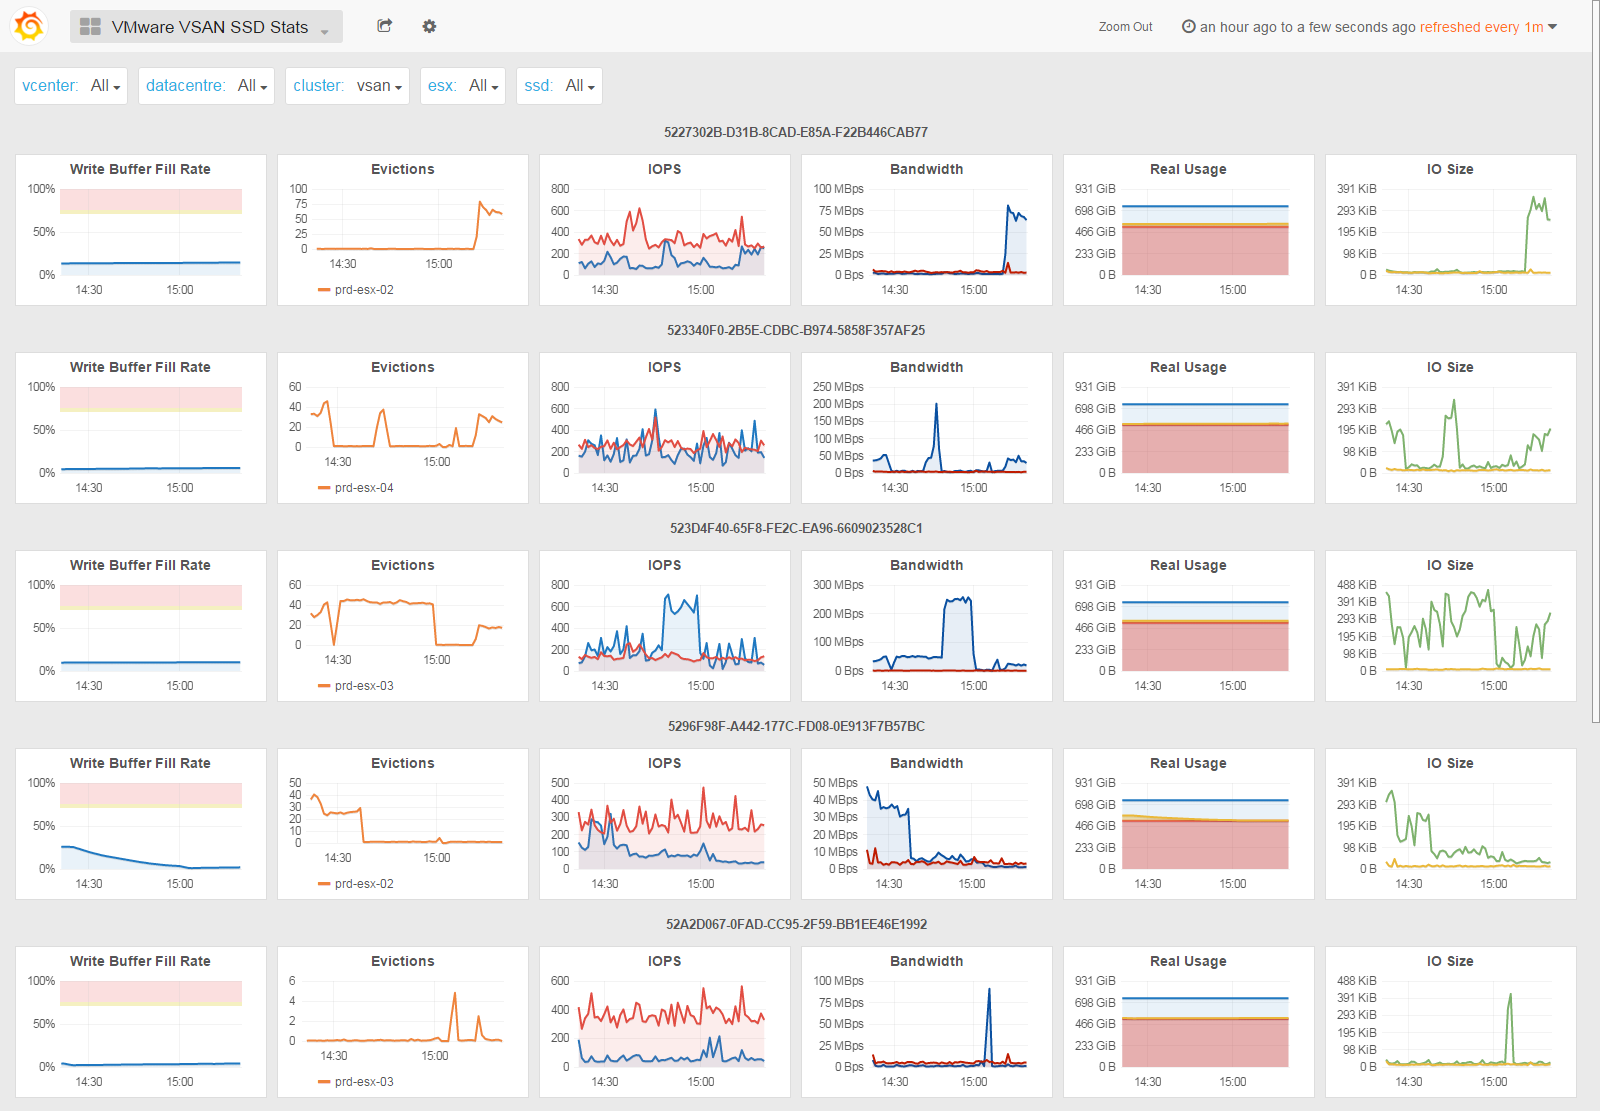
The vSAN SSD Stats dashboard shows various statistics from the caching devices of the vSAN diskgroups.
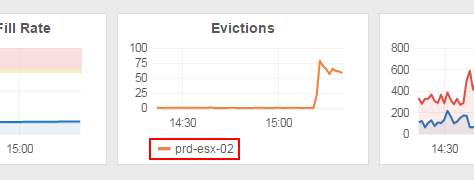
The Write Buffer Fill Rate graph is probably the most important as it helps to understand how fast the write buffer fills up and how fast the data are flushed on disk (or flash capacity). As per vSAN Observer settings, the threshold of this metric is 75%.
According to VMware Virtual SAN Diagnostics and Troubleshooting Reference Manual “One would expect that on a reasonably balanced system that a significant amount of write buffer is consumed. This is a good metric to check if you are planning to place more workloads on Virtual SAN. It can tell you whether you have enough flash capacity to cater for the additional workloads.”
The Evictions graph is described in VMware Virtual SAN Diagnostics and Troubleshooting Reference Manual as “how often Virtual SAN has to evict data blocks from the write buffer to make room for new data blocks. […] Excessive evictions could mean that there are workloads running that are not suitable for a caching storage system like Virtual SAN (sustained sequential write operations), or that the flash cache has been undersized for the workload requirements.”
The IOPS and Bandwidth graph are obviously speaking for themselves.
If you need to know where is the SSD your’re looking at, check the Evictions graph legend:
Starting from SexiGraf 0.99b we’ve added 2 new rows: Real Usage that let you monitor the vSAN flash tier filling up and IO Size that speaks for itself.
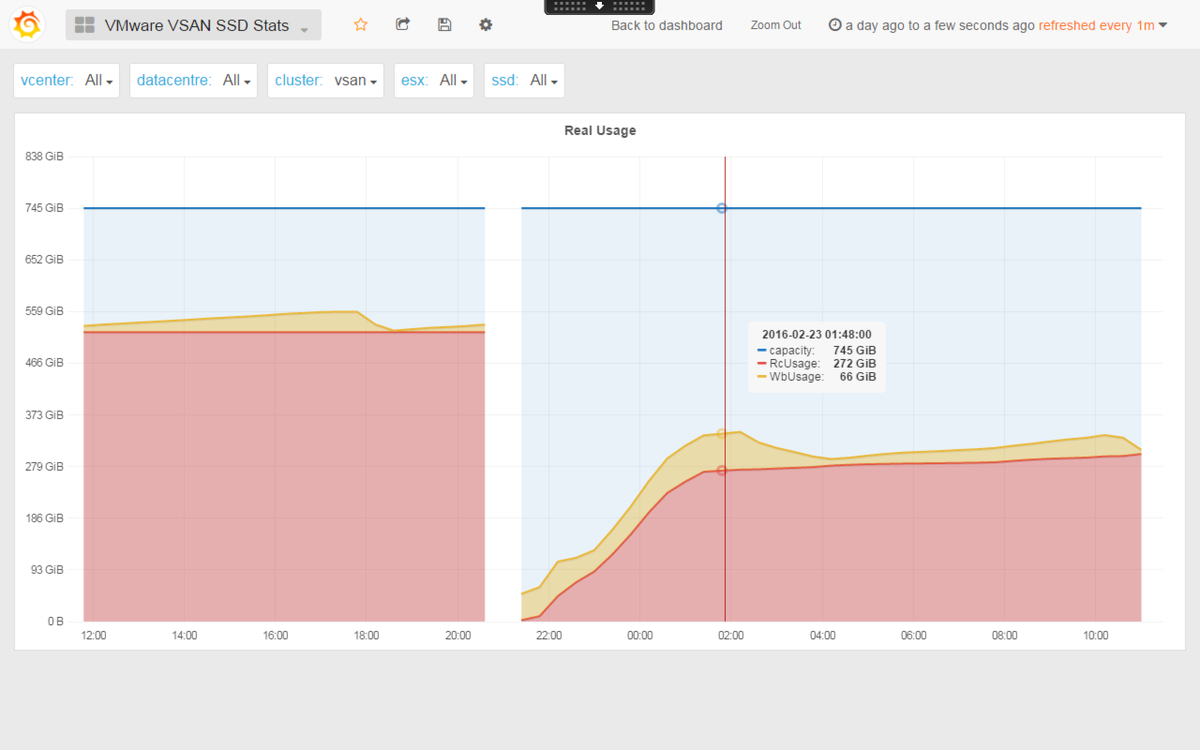
The Real Usage row may be very usefull to measure read cache warm up duration.
vSAN Top N vmdk
The vSAN Top N vmdk dashboard (added in SexiGraf 0.99a) let you immediately identify the most active VMs on your vsanDatastore “like” the infamously slow Virtual Machine Disk (Top 10) which is not available for vSAN datastores :
You’ll be able to observe flat vmdk as well as snapshots redo logs activity, select only few vm disks to inspect and also chose between Current, Average or Max consolidation over the selected time range:
vSAN Resync
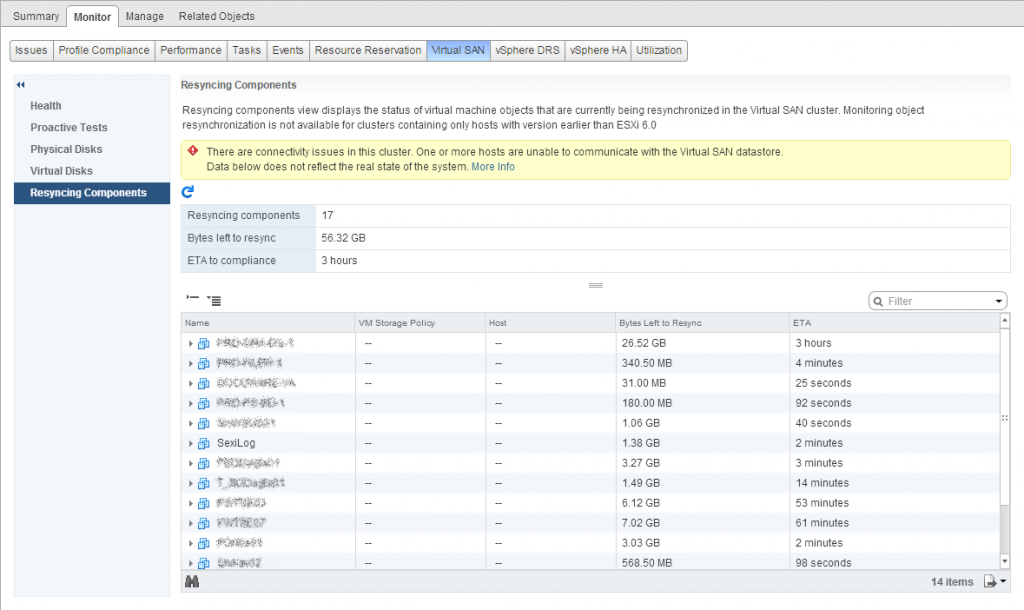
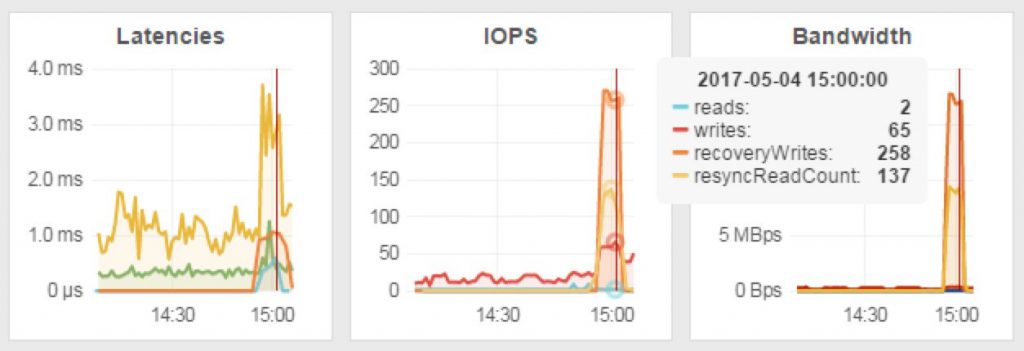
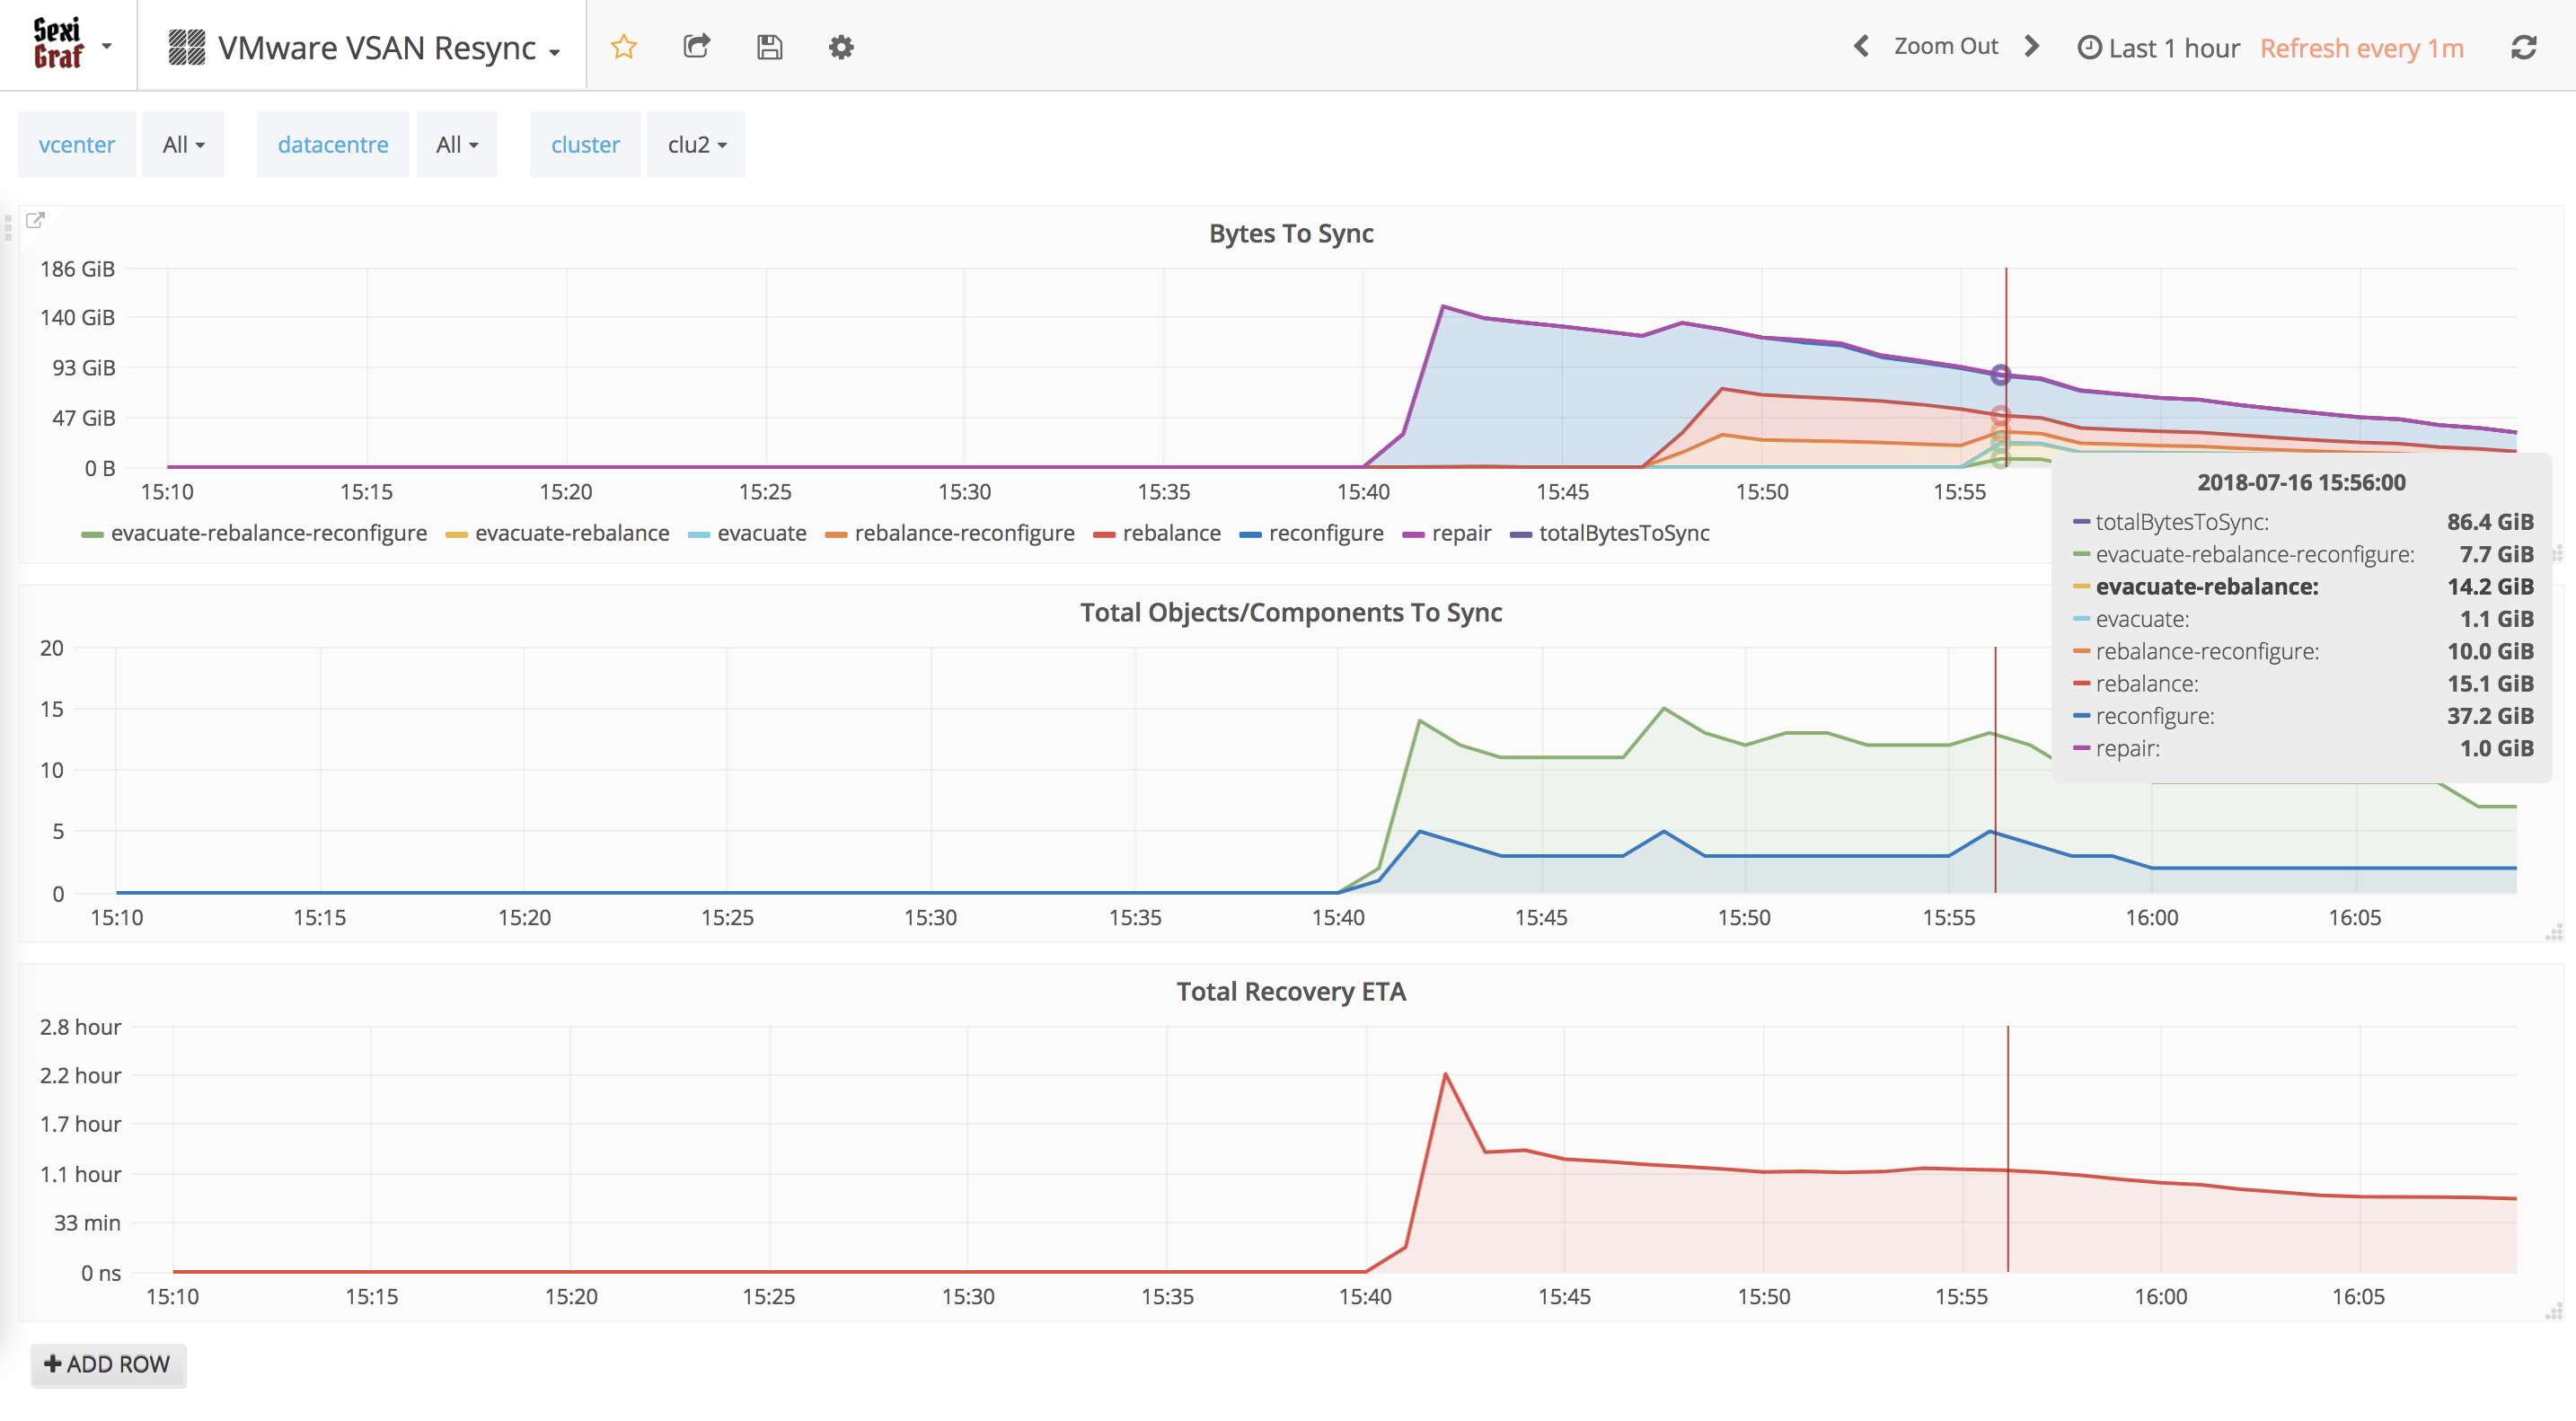
Instead of endlessly clicking on the refresh button in the “Resyncing Components” tab of the WebClient, we added the vSAN Resync dashboard since SexiGraf 0.99b:
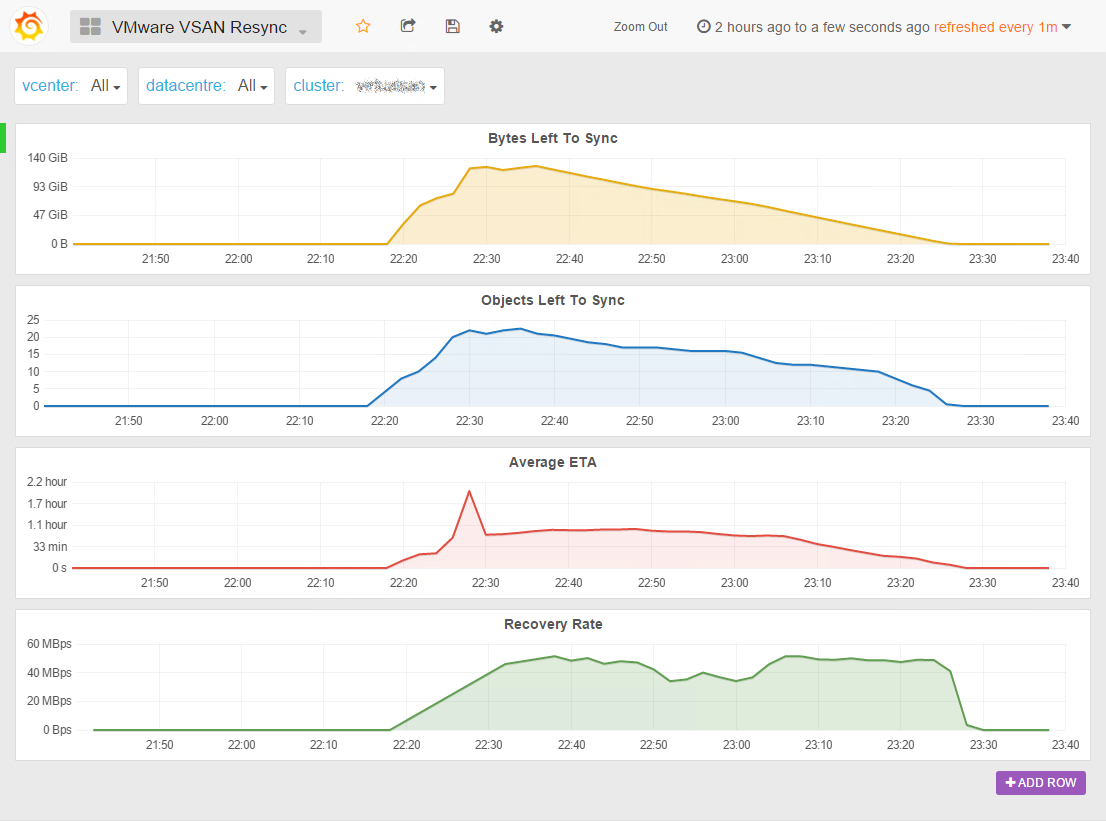
Now you can really see what’s going on when objects are being resynced, rebuilded or rebalanced. We also added a Recovery Rate graph to check how fast your vSAN backend performs.
Starting from version 0.99e, we pushed even further and leveraged the vSAN 6.7 API when available. In vSAN 6.7 VMware introduced the Sync State Reason so you also know WHY the components are being (re)sync. And if some components are synced for several reasons, you’ll know it too of course. Only in SexiGraf 😉
The list of reasons indicate why the component went into syncing state. The API returns full list of reasons for background. However, sometimes it’s userful to generate an aggregate reason, in which case the following priorities could be used:
P0: “evacuate” ()
P1: “dying_evacuate” ()
P2: “rebalance” ()
P3: “repair”, “reconfigure” ()
P4: “stale”dying_evacuate: The component is being moved out when a disk is going to die.
evacuate: The component is created and resyncing after evacuate disk group or host to ensure accessibility and full data evacuation.
rebalance: The component is created and resyncing for rebalancing.
reconfigure: The component is created and resyncing after vSAN object was resized or its policy was changed.
repair: The component is created and resyncing to repair a bad component.
stale: The component is syncing because it was stale.
vSAN NAA Latency
The vSAN NAA Latency dashboard (added in SexiGraf 0.99b) let you check the individual latencies of every single device in the vSAN cluster sorted by Network Addressing Authority identifier.
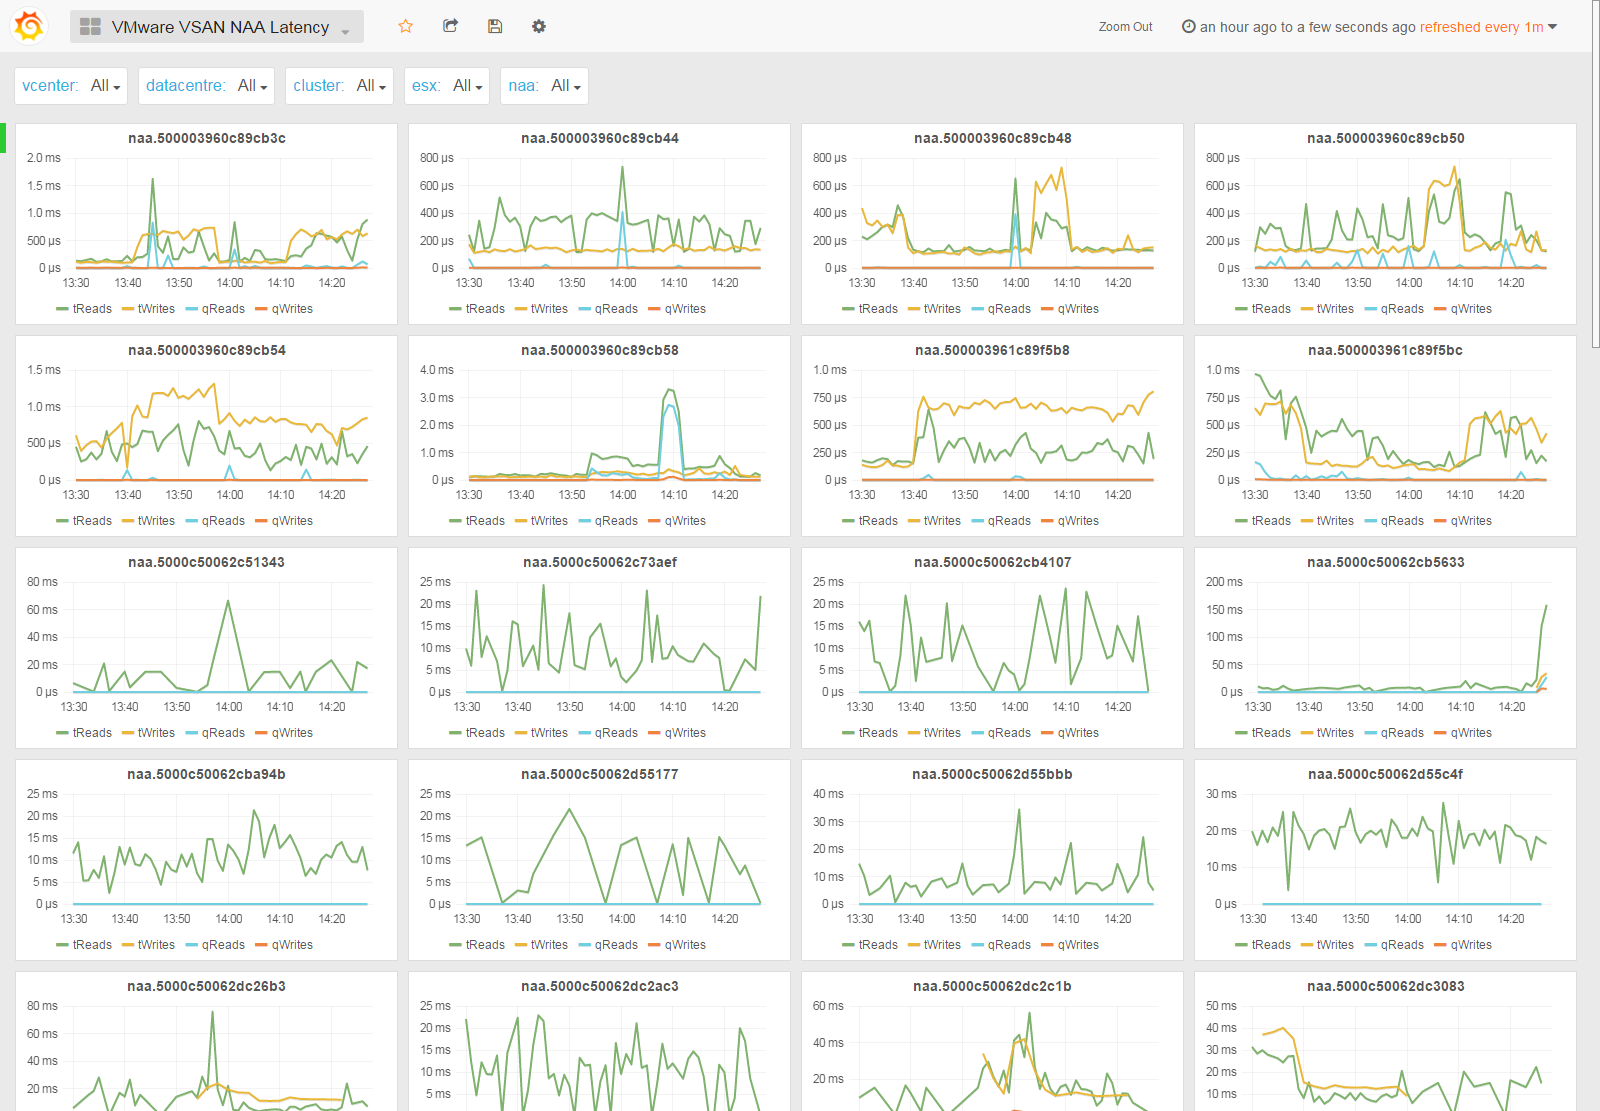
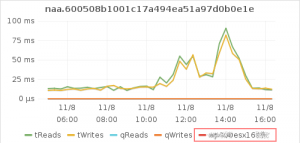
In v0.99d we’ve also added the hostname owner of the device on each graphic:
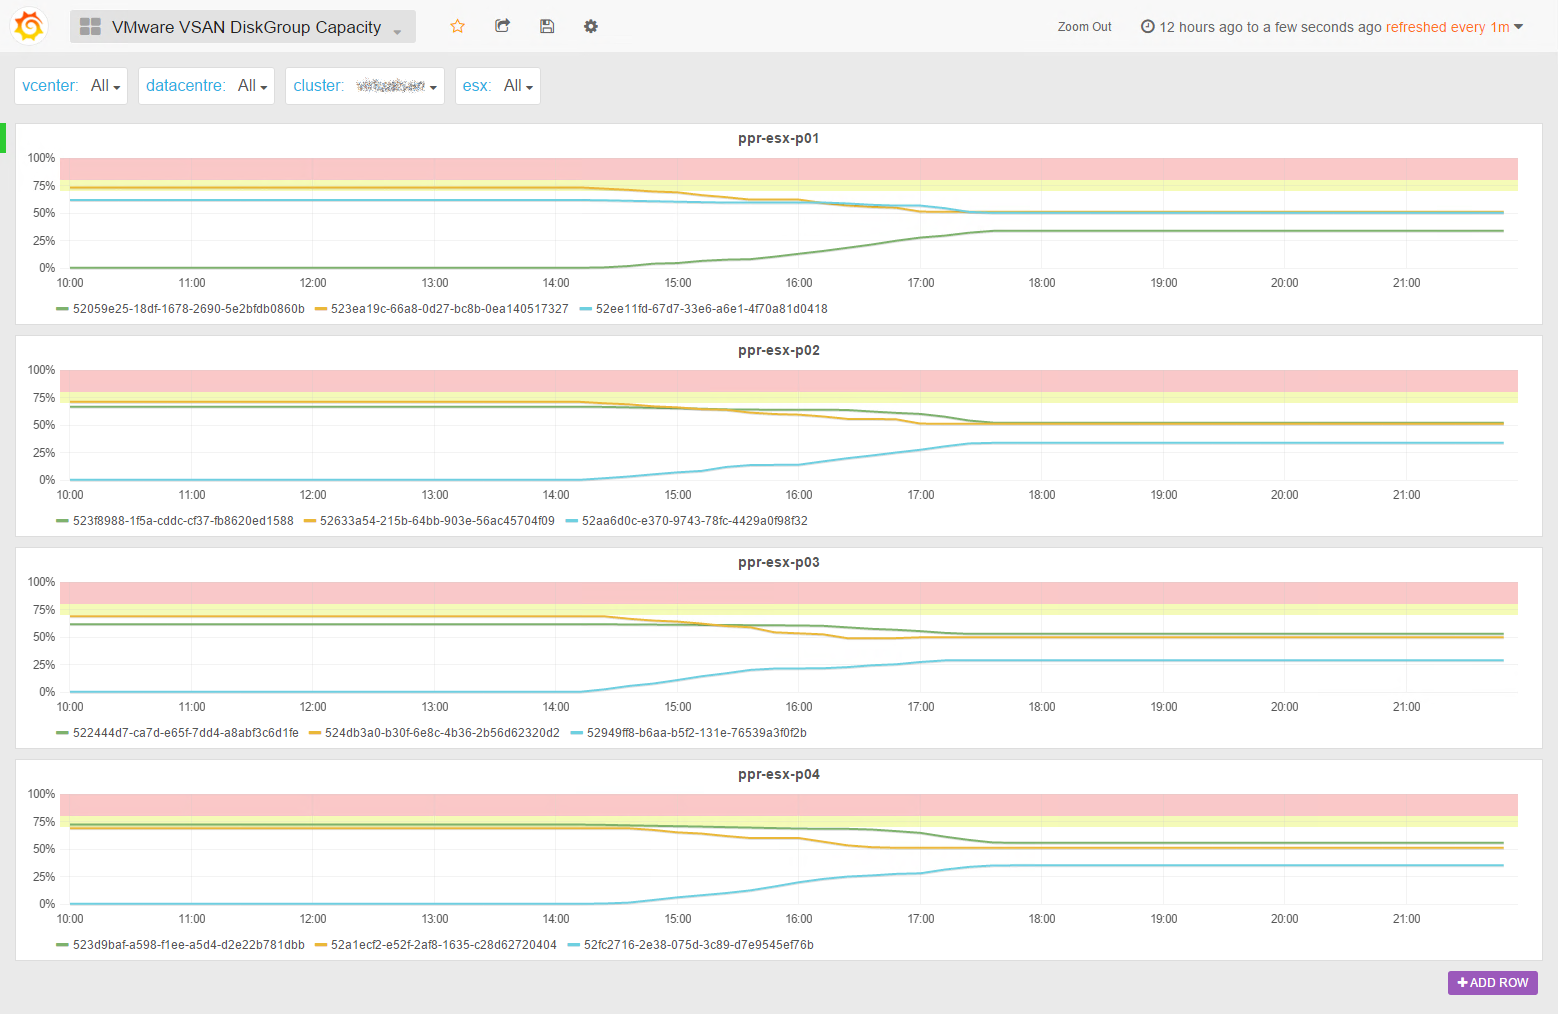
vSAN DiskGroup Capacity
In SexiGraf 0.99b we added an enhanced version of the initial vSAN Capacity dashboard. The vSAN DiskGroup Capacity let you monitor the space usage of each diskgroup of each cluster node. Now you see what is going on when you manually initiate Proactive Rebalance.
vSAN Space Usage Report
SexiGraf 0.99c ships with vSAN 6.2 SDK enabling new kind of dashboards. vSAN Space Usage Report aims to enhance the vSAN Capacity tab in the vSphere Web Client:
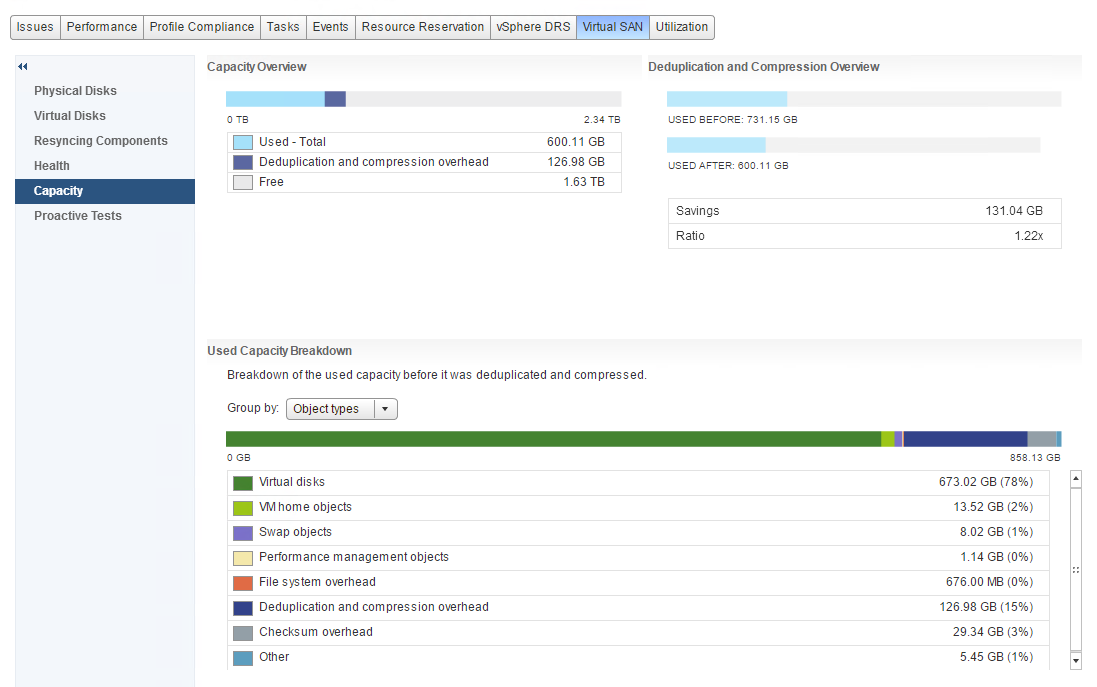
You should check the excellent Cormac’s blog post regarding the role of each object type but also the SDK documentation to match with the “interal” property names.
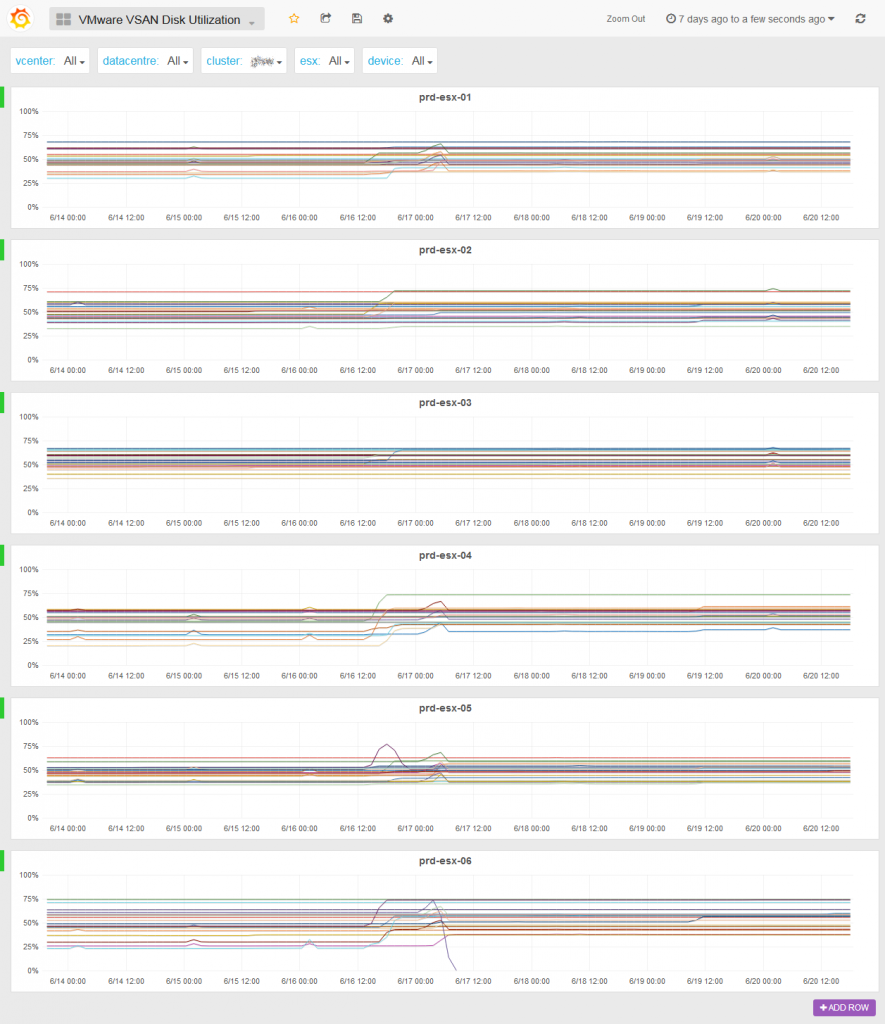
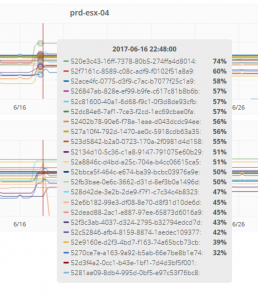
vSAN Disk Utilization
The vSAN DiskGroup Capacity dashboard is really useful to monitor the vSAN space usage and distribution but sometime you would need to monitor the space consumption at the device level. For instance, when you evacuate a device to replace it, it’s critical to be able to follow the ongoing process. That’s why in SexiGraf 0.99d we added the vSAN Disk Utilization dashboard: