Since the first release we wanted to add a SMART counters dashboard because we were so inspired by the Backblaze reports. But we never found a proper way to get those stats from any kind of NAS so we decided to rely on a custom script that pushes the data to graphite using netcat 😉
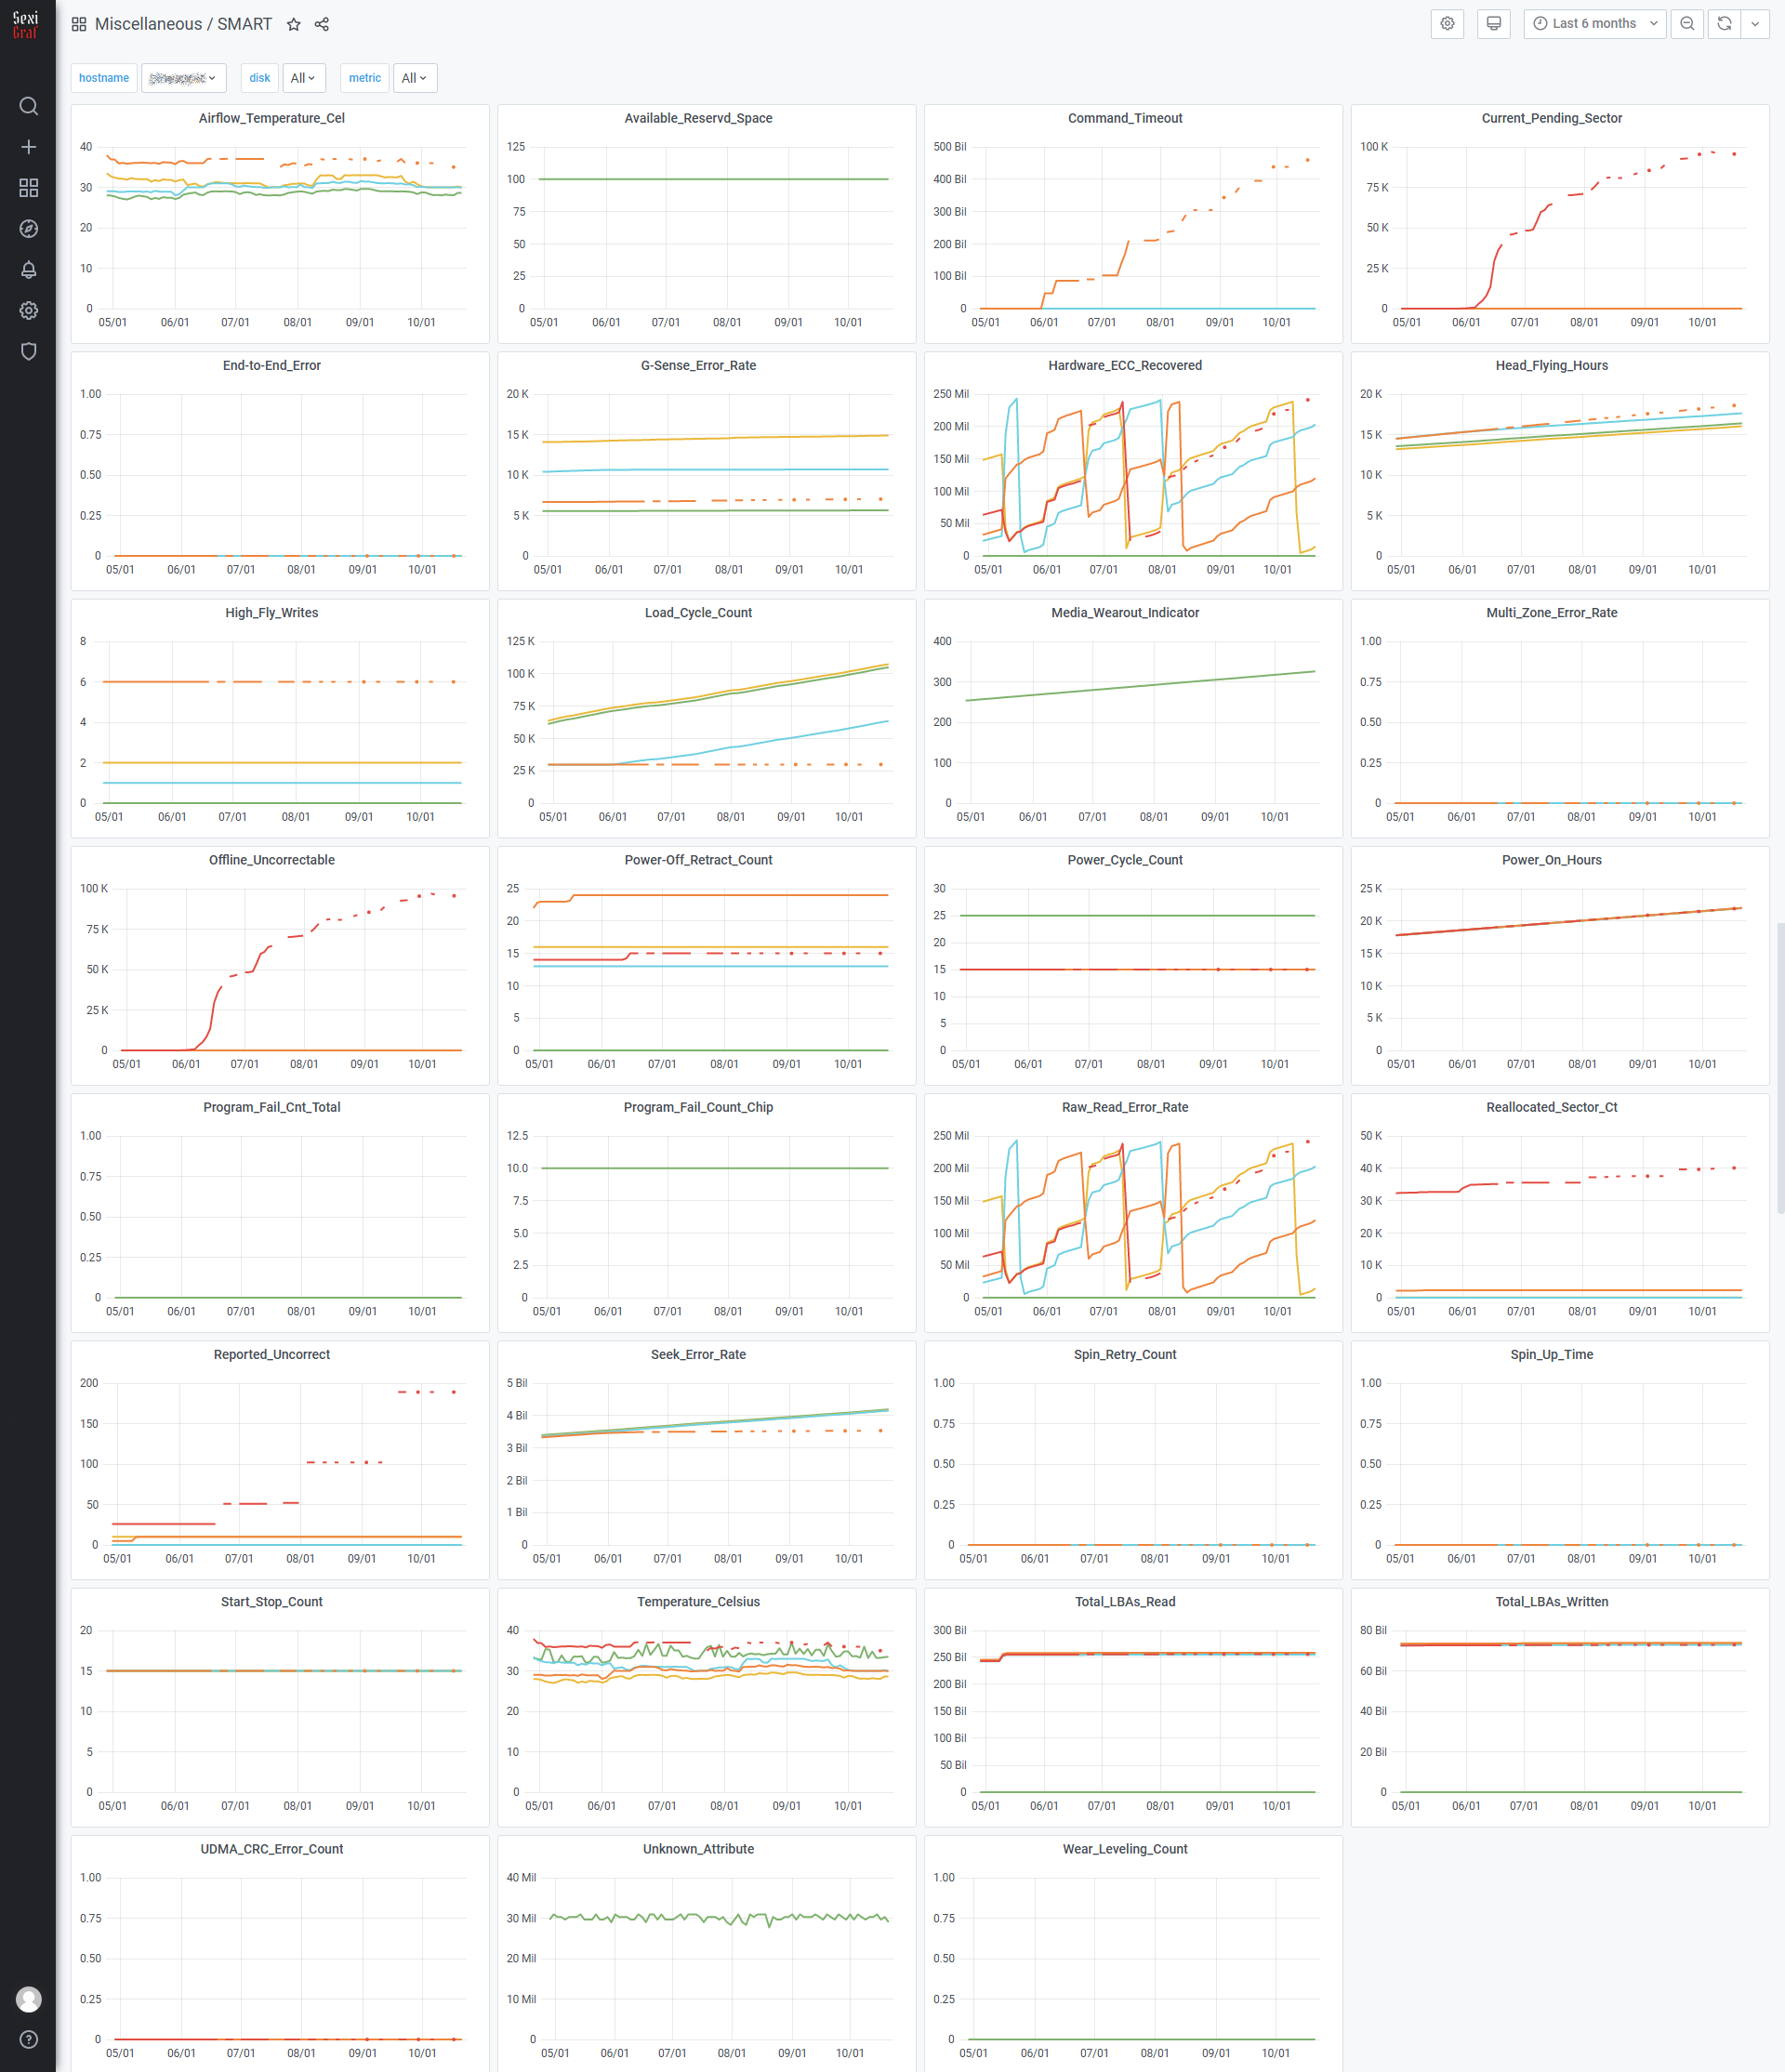
You can clearly notice one of the disks is going to die soon here!
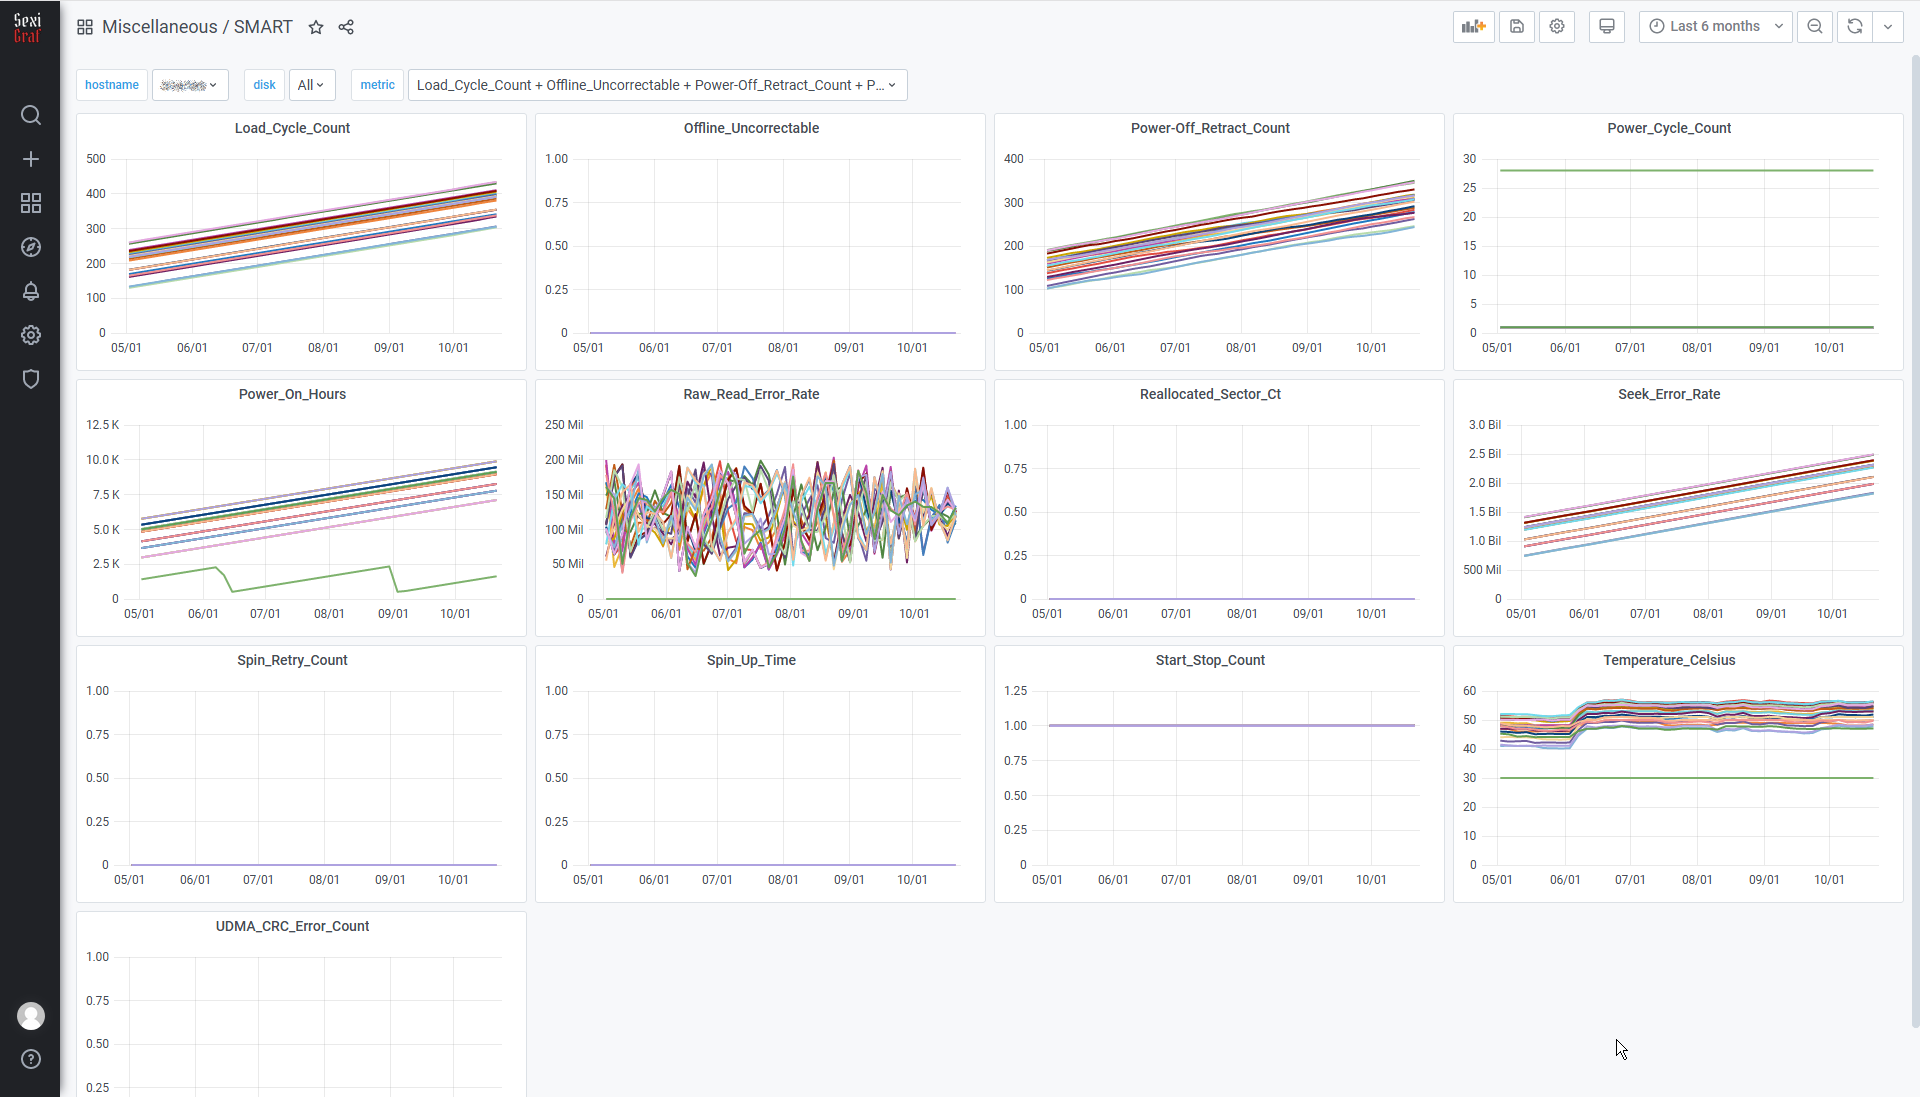
Some disks or SSDs are less verbose than others…
This script was created for FreeNas/TrueNas initially but you can adapt it to any systems as long as you respect this simple output format (time in epoch format): smart.$hostname.$disk.$countername value time
#! /bin/shfor diskname in $(/sbin/sysctl -n kern.disks | /usr/bin/tr " " "\n")do/usr/local/sbin/smartctl -A /dev/$diskname | /usr/bin/grep -i 0x0 | /usr/bin/awk -v var="$diskname" '{system ("echo smart.$(/bin/hostname -s)" "." var "." $2 " "$10 " $(date +%s)")}'|/usr/bin/nc -w 3 sexigraf.sexibyt.es 2003done
Don’t forget to replace “sexigraf.sexibyt.es” by your own appliance FQDN or IP target.
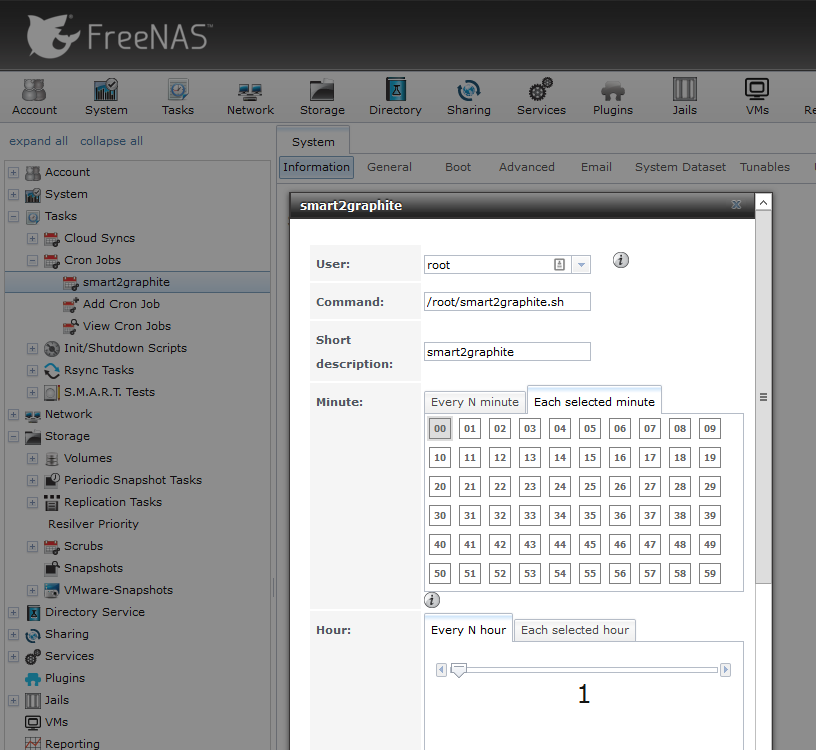
In FreeNas you can easily create a new crontab using the UI: