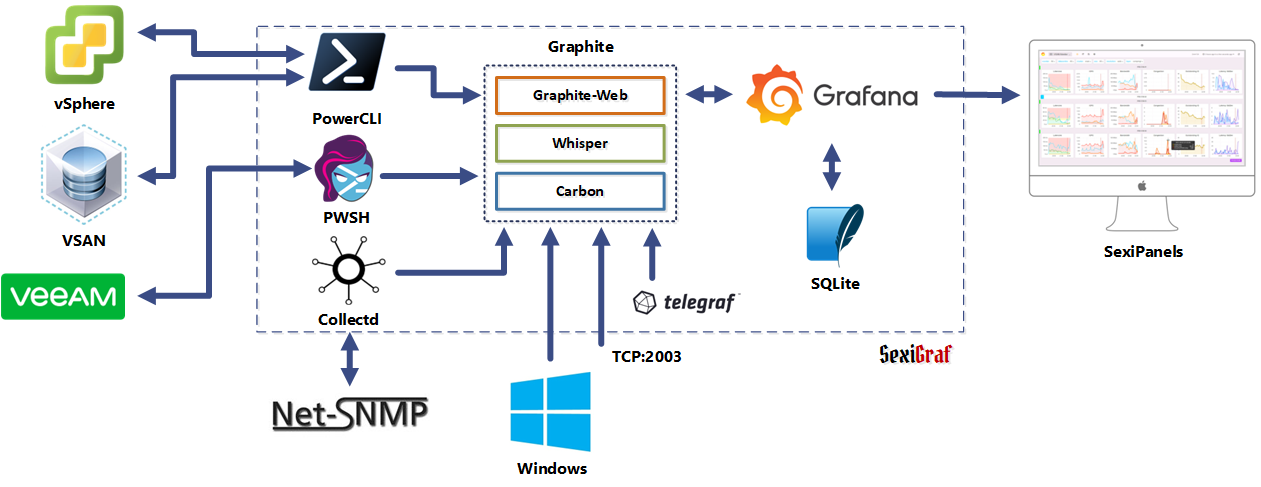
SexiGraf is a vSphere centric Graphite appliance with a Grafana frontend. Here is what’s under the hood:
- VMware PowerCLI is used to pull VI and vSAN metrics from VMware vCenter APIs and pushed to carbon (Perl SDK was used in previous versions).
- Powershell Core is used to send requests to Veeam Backup RESTful web service.
- Collectd is here to monitor your SexiGraf appliance (see the Home page) but it will also be used to collect SNMP metrics in the future.
- Telegraf is used to monitor local Apache server but could also be used for other purposes like IPMI checks.
- Carbon is listening on TCP:2003 so you can send any metrics you like in plaintext (like Windows counters…)
- Grafana uses Graphite-Web APIs to query Whisper files and produce the gorgeous dashboards we love so much!
![]()
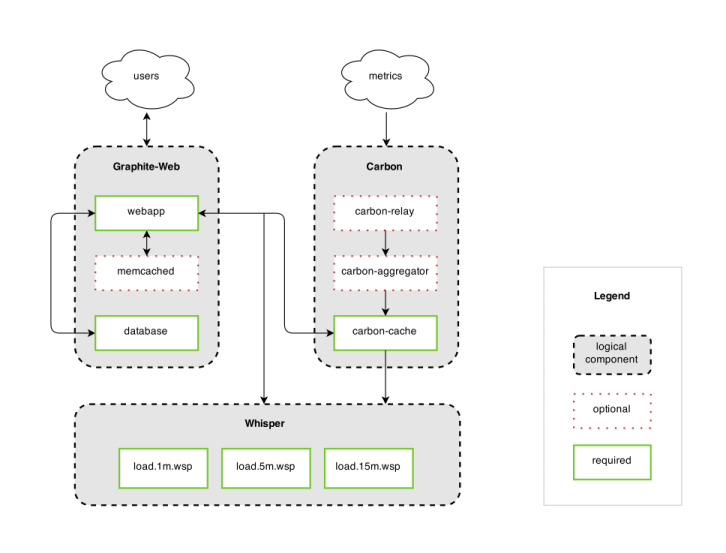
The heart of SexiGraf is the famous highly scalable real-time graphing system : Graphite. As described by his creator, it consists of three major components:
- Graphite-Web, a Django-based web application that renders graphs and dashboards
- The Carbon metric processing daemons
- The Whisper time-series database library